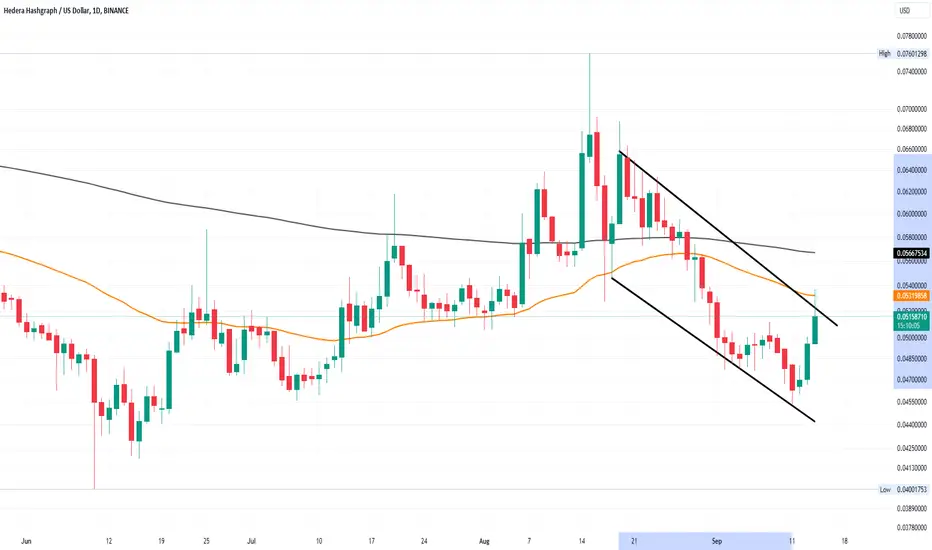
HBAR price action finds a bullish reversal at $0.050.
The MACD indicator indicates a bullish crossover.
A closing price above the 50-day EMA could propel HBAR to $0.069.
HBAR coin price saw a sharp recovery from $0.40 to $0.75.
Overhead supply pressure caused a bearish breakout from the rising channel pattern.
The price dropped to $0.045, marking a 30% drop within a month.
The downtrend prevented a golden crossover between the 50-day and 200-day EMA.
A bullish reversal is forming with a morning star pattern at $0.045.
The current HBAR coin price is $0.053175.
The 4-hour chart shows a bearish channel pattern.
A bullish breakout is anticipated, but a sideways trend might occur first.
If prices don't surpass the 200-day EMA, a retest of the $0.044 support level is likely.
Disclaimer
The information and publications are not meant to be, and do not constitute, financial, investment, trading, or other types of advice or recommendations supplied or endorsed by TradingView. Read more in the Terms of Use.
Disclaimer
The information and publications are not meant to be, and do not constitute, financial, investment, trading, or other types of advice or recommendations supplied or endorsed by TradingView. Read more in the Terms of Use.
