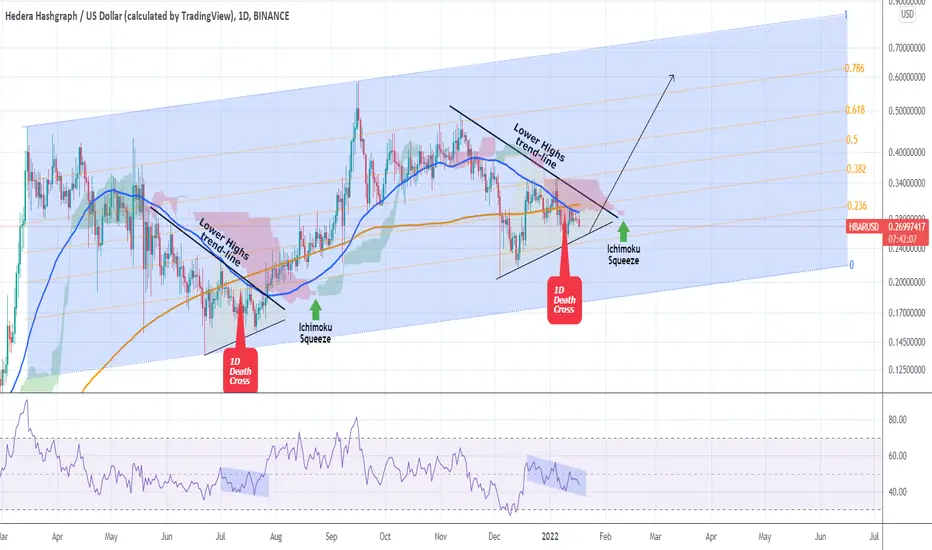
Hedera Hashgraph may be on Higher Lows since the December 04 sell-off, showing more promise compared to the market average, but remains under the selling pressure of the Lower Highs trend-line of the November High.
As this 1D chart shows, a very similar Lower Highs trend-line, has taken place during the previous HBARUSD correction in May - June - July 2021. The price however broke above the trend-line after a series of 3 events:
* 1st the 1D MA50 (blue trend-line) crossed below the 1D MA200 (orange trend-line) to form the Death Cross. Even though that's typically a bearish formation, it signaled a bottom on that last May - July correction.
* 2nd the RSI was on a Channel Down that also broke upwards.
* 3rd the Ichimoku Cloud rolled over (squeeze).
The price has currently fulfilled all the above parameters that kick-started the August - September rally. It remains to be seen if the Higher Lows trend-line can hold and push the price above the Lower Highs trend-line. What do you think?
--------------------------------------------------------------------------------------------------------
** Please support this idea with your likes and comments, it is the best way to keep it relevant and support me. **
--------------------------------------------------------------------------------------------------------
👑Best Signals (Forex/Crypto+70% accuracy) & Account Management (+20% profit/month on 10k accounts)
💰Free Channel t.me/tradingshotglobal
🤵Contact info@tradingshot.com t.me/tradingshot
🔥New service: next X100 crypto GEMS!
💰Free Channel t.me/tradingshotglobal
🤵Contact info@tradingshot.com t.me/tradingshot
🔥New service: next X100 crypto GEMS!
Disclaimer
The information and publications are not meant to be, and do not constitute, financial, investment, trading, or other types of advice or recommendations supplied or endorsed by TradingView. Read more in the Terms of Use.