PENDLEUSDT 1D Chart Analysis|Bullish Breakout Eyes Higher Target
PENDLEUSDT 1D Chart Analysis | Bullish Breakout Eyes Higher Targets
🔍 Let’s break down the PENDLE/USDT daily chart, focusing on breakouts above key resistance, Fibonacci retracement dynamics, RSI momentum, and volume confirmation for a comprehensive bullish setup.
⏳ Daily Overview
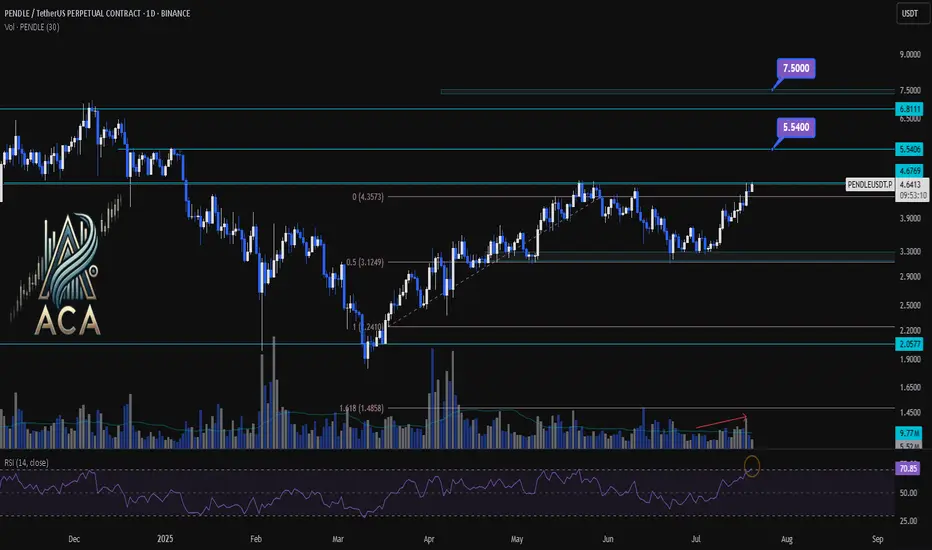
PENDLE has staged a powerful recovery after pulling back to the 0.5 Fibonacci retracement level (around $3.12). Price is now testing the critical $4.68 resistance—the ceiling from the last corrective wave. RSI has jumped above 71, entering the overbought zone, a classic precursor to strong momentum moves. Volume is rising as bulls attempt a breakout, confirming participation behind the price action.
📈 Technical Convergence and Trend Structure
- Fibonacci Structure: The correction held the 0.5 retracement, a textbook bullish reversal zone in rising trends.
- Resistance Breakout: Price is challenging the $4.68 resistance. A daily close above, especially with high volume, would confirm the breakout and trigger bullish continuation.
- RSI Indicator: RSI has cleared the 70 mark, reinforcing strong momentum. Overbought RSI often supports further rallies when backed by breakout moves and rising volume.
- Volume Confirmation: Volume surged as PENDLE reclaimed lost ground and is now accelerating into the resistance test, suggesting trend conviction and confirming the move.
🔺 Bullish Setup & Targets
- First target: $5.54 — the next resistance based on historical supply and Fibonacci extension.
- If macro conditions like interest rate cuts align, the next potential target: $7.50 — the major extension target where price discovery is likely.
- Key trigger: A strong daily (or weekly) close above $4.68, combined with breakout volume, is likely to ignite the next leg up.
📊 Key Highlights
- Correction held at the 0.5 Fibo, signaling trend health and resetting momentum.
- A bullish daily structure aligned with a weekly breakout confluence.
- RSI and price action both making new local highs — strong uptrend indication.
- Volume confirming the move—a real breakout is underway, not a false start.
🚨 Conclusion
PENDLE/USDT looks primed for continuation higher. The blend of a successful 0.5 retracement retest, breakout attempt above $4.68, robust RSI, and volume surge all point to bullish follow-through. Watch for a confirmed close above resistance as the catalyst for further upside, with $5.54 and $7.50 the next logical targets if momentum persists.
🔍 Let’s break down the PENDLE/USDT daily chart, focusing on breakouts above key resistance, Fibonacci retracement dynamics, RSI momentum, and volume confirmation for a comprehensive bullish setup.
⏳ Daily Overview
PENDLE has staged a powerful recovery after pulling back to the 0.5 Fibonacci retracement level (around $3.12). Price is now testing the critical $4.68 resistance—the ceiling from the last corrective wave. RSI has jumped above 71, entering the overbought zone, a classic precursor to strong momentum moves. Volume is rising as bulls attempt a breakout, confirming participation behind the price action.
📈 Technical Convergence and Trend Structure
- Fibonacci Structure: The correction held the 0.5 retracement, a textbook bullish reversal zone in rising trends.
- Resistance Breakout: Price is challenging the $4.68 resistance. A daily close above, especially with high volume, would confirm the breakout and trigger bullish continuation.
- RSI Indicator: RSI has cleared the 70 mark, reinforcing strong momentum. Overbought RSI often supports further rallies when backed by breakout moves and rising volume.
- Volume Confirmation: Volume surged as PENDLE reclaimed lost ground and is now accelerating into the resistance test, suggesting trend conviction and confirming the move.
🔺 Bullish Setup & Targets
- First target: $5.54 — the next resistance based on historical supply and Fibonacci extension.
- If macro conditions like interest rate cuts align, the next potential target: $7.50 — the major extension target where price discovery is likely.
- Key trigger: A strong daily (or weekly) close above $4.68, combined with breakout volume, is likely to ignite the next leg up.
📊 Key Highlights
- Correction held at the 0.5 Fibo, signaling trend health and resetting momentum.
- A bullish daily structure aligned with a weekly breakout confluence.
- RSI and price action both making new local highs — strong uptrend indication.
- Volume confirming the move—a real breakout is underway, not a false start.
🚨 Conclusion
PENDLE/USDT looks primed for continuation higher. The blend of a successful 0.5 retracement retest, breakout attempt above $4.68, robust RSI, and volume surge all point to bullish follow-through. Watch for a confirmed close above resistance as the catalyst for further upside, with $5.54 and $7.50 the next logical targets if momentum persists.
Disclaimer
The information and publications are not meant to be, and do not constitute, financial, investment, trading, or other types of advice or recommendations supplied or endorsed by TradingView. Read more in the Terms of Use.
Disclaimer
The information and publications are not meant to be, and do not constitute, financial, investment, trading, or other types of advice or recommendations supplied or endorsed by TradingView. Read more in the Terms of Use.