PENDLE ranging = preparing for a movePENDLE is in a nice range. The price is currently in the middle of the range; however, if it gets overbought, it is likely that the price will visit the top of the range. If this range ultimately forms a bull flag, there is upside potential to consider.
Full TA: Link in the BIO

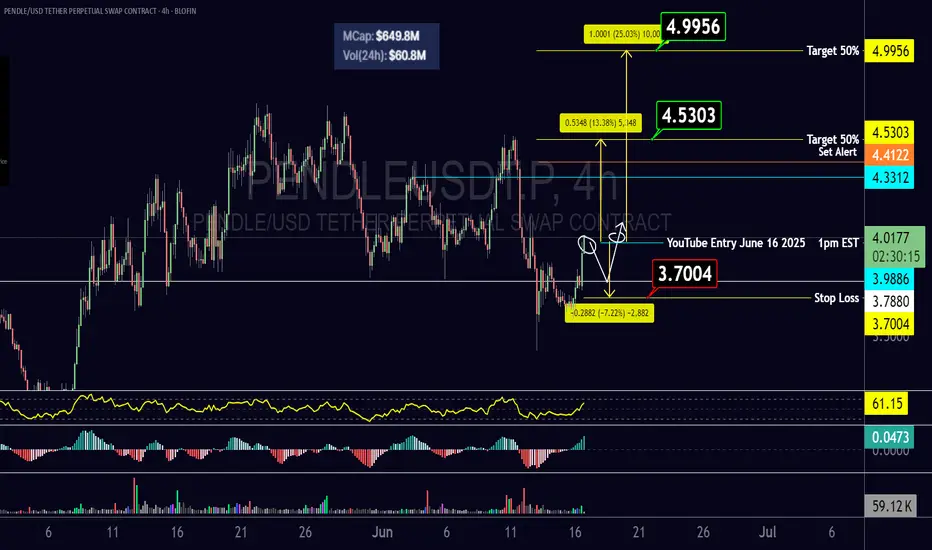
PENDLE movingPENDLE broke resistance and previous high
we might see a pullback before a continuation to the upside
if stopped out ... then look for re-entry on the 4hr break
of the newly created high ( not created yet )
PENDLE – Bullish Continuation Setup from Key Support ZonePENDLE remains one of the standout performers in the crypto space, maintaining its bullish market structure even amid broader market uncertainty. With price currently holding well above key support, this presents a favorable opportunity for a swing long position, especially if the broader market sta
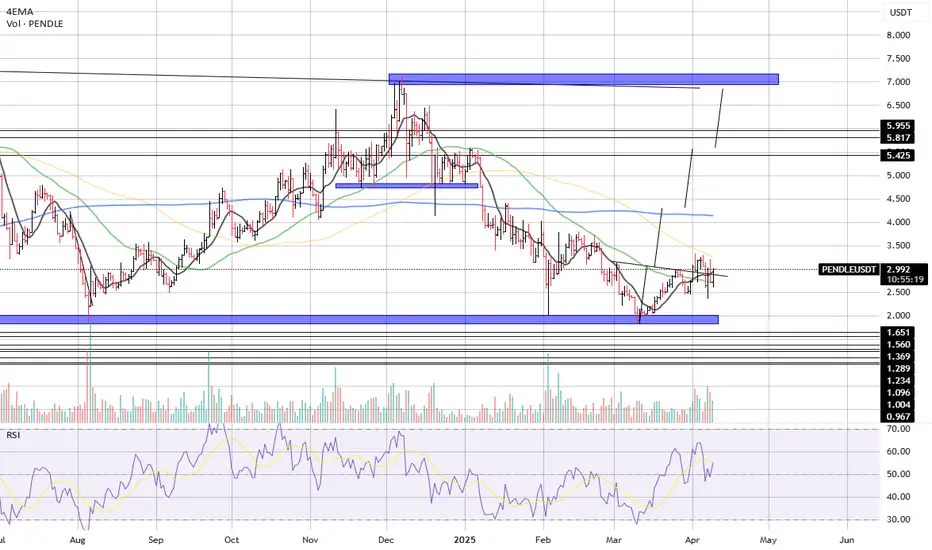
PENDLE/USDT Technical Analysis – April 9, 2025🔍 Market Structure & Price Action
PENDLE has recently bounced from a significant demand zone around the $2.00–$2.20 area, highlighted by the thick blue box at the bottom of the chart. This area has acted as strong support in the past and shows renewed buying interest, evident from the bullish revers
PENDLE – Bullish Continuation?After months of consolidation, PENDLE appears ready to break out of its weekly range.
RSI breakout: Momentum has finally pushed through a long-term descending trendline — a potential shift in trend strength.
Technical structure: Clear higher lows, repeated resistance tests — bulls may be gaining c

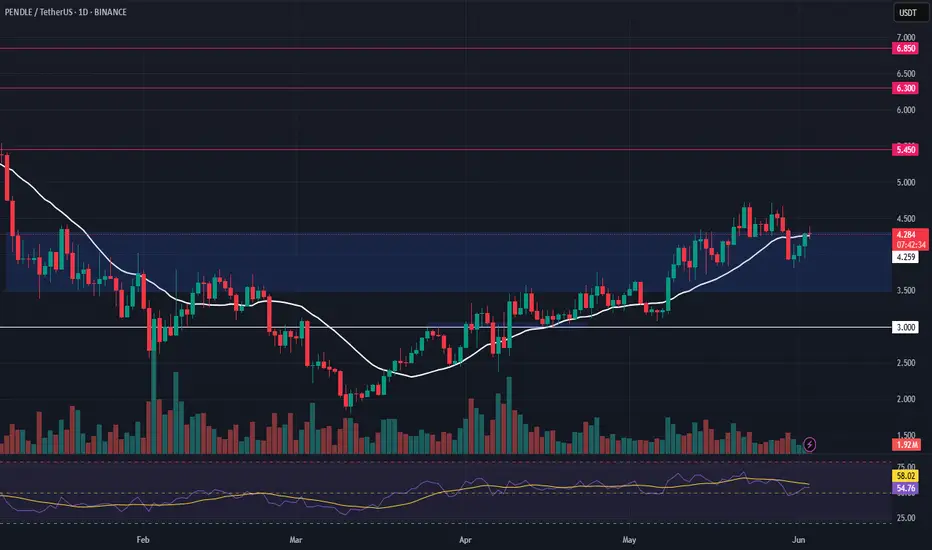
PENDLEUSDT → Resistance retest. One step away from distributionBINANCE:PENDLEUSDT is preparing for distribution after a prolonged consolidation. The price is testing a key resistance level, which, if broken, will trigger a rally...
The coin is breaking through the flat resistance and consolidating above the upper border of the range. The key level is 4.40

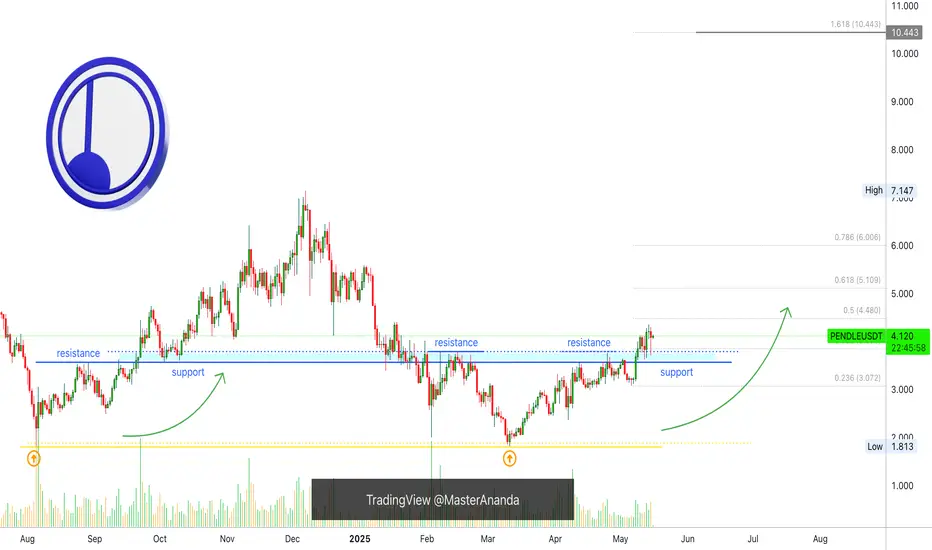
Pendle New ATH, Resistance & Support —Highest Ever Within MonthsWatch the same price range alternate between resistance and support, the blue line/space on the chart.
There is also a long-term double-bottom and the Adam & Eve formation, all together in the same chart.
This paints a picture of a changing cycle. The recovery from the A&E is quite strong. From th
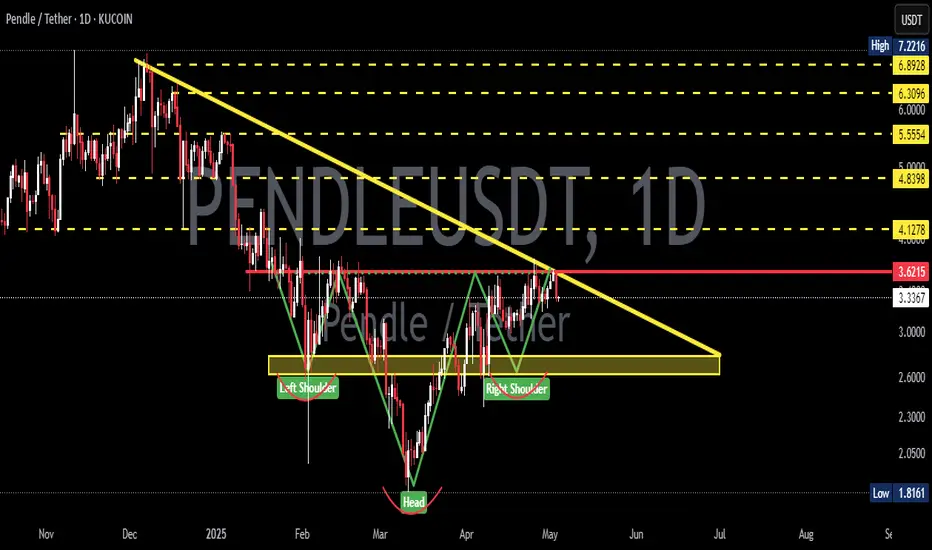
PENDLE Bearish Head and Shoulders – Potential Pullback at the Ne CRYPTOCAP:PENDLE Bearish Head and Shoulders – Potential Pullback at the Neckline 📉
CRYPTOCAP:PENDLE has formed a bearish head and shoulders pattern. We could see a potential pullback at the neckline before the price moves down to the green line level as the next target. 📊

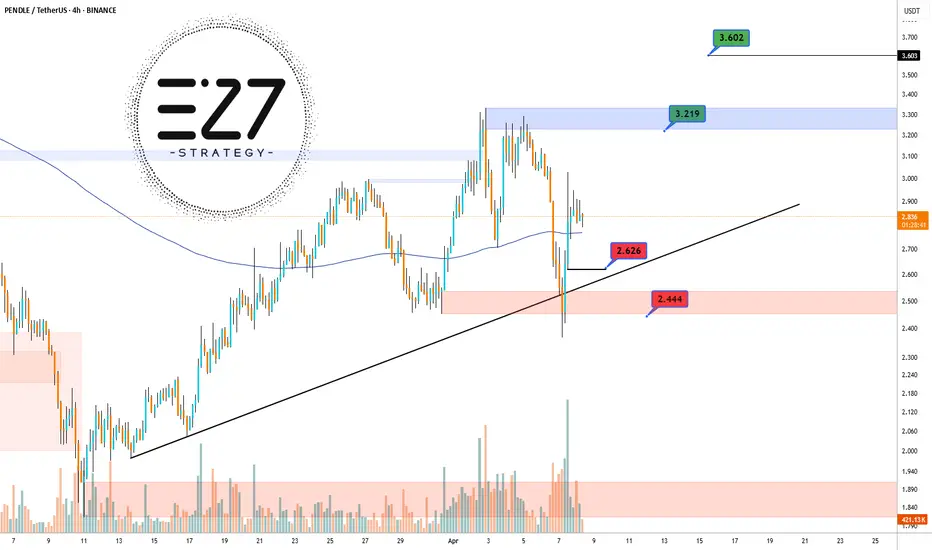
PENDLEUSDT 📈 PENDLEUSDT 4H Analysis:
Price rebounded from the 2.444 demand zone after a short-term breakdown and is now stabilizing above the 200 EMA, with the bullish trendline still intact. Key resistance lies at 3.219, and breaking it could open the path to 3.602. However, a drop below 2.626 and the trendli
PENDLEUSDT 2D AnalysisPENDLE ~ 2D Analysis
#PENDLE Buy when re -testing this support block or buy after successfully penetrating this resistant line with a short -term target of at least 10%+.
See all ideas
Summarizing what the indicators are suggesting.
Oscillators
Neutral
SellBuy
Strong sellStrong buy
Strong sellSellNeutralBuyStrong buy
Oscillators
Neutral
SellBuy
Strong sellStrong buy
Strong sellSellNeutralBuyStrong buy
Summary
Neutral
SellBuy
Strong sellStrong buy
Strong sellSellNeutralBuyStrong buy
Summary
Neutral
SellBuy
Strong sellStrong buy
Strong sellSellNeutralBuyStrong buy
Summary
Neutral
SellBuy
Strong sellStrong buy
Strong sellSellNeutralBuyStrong buy
Moving Averages
Neutral
SellBuy
Strong sellStrong buy
Strong sellSellNeutralBuyStrong buy
Moving Averages
Neutral
SellBuy
Strong sellStrong buy
Strong sellSellNeutralBuyStrong buy
Displays a symbol's price movements over previous years to identify recurring trends.