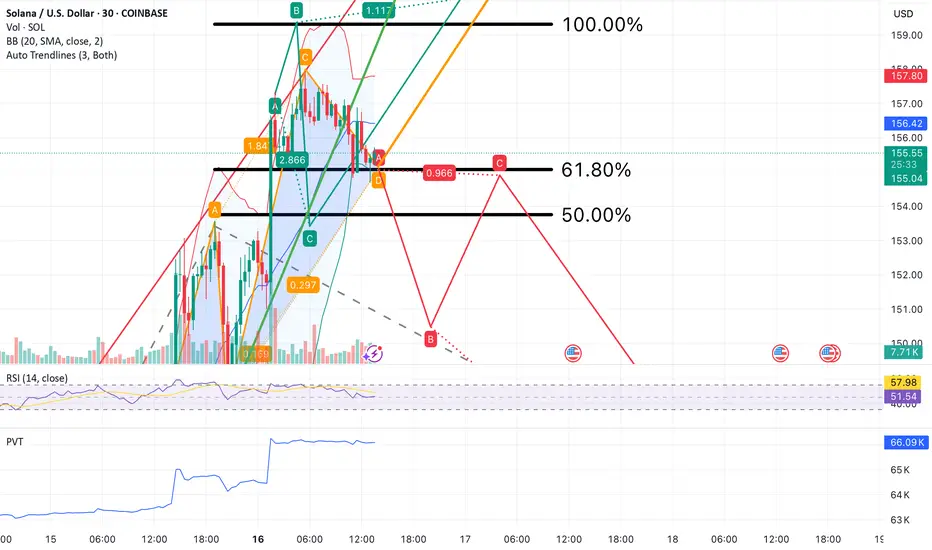
Solana (SOL) is trading at a pivotal zone where price structure, harmonic patterns, and key technical indicators converge. This setup outlines three potential scenarios, guided by Fibonacci levels, auto trendlines, and momentum indicators.
Green Scenario (Confirmed Bullish Continuation)
A sustained hold above $155, especially if followed by a breakout through $156.50 with rising volume, would confirm the green path. This scenario reflects short-term bullish momentum strengthening, as RSI remains near 60 and PVT continues to climb. If confirmed, price may extend toward $160, with secondary targets in the $165–$172 range, aligning with the upper ascending trendline and harmonic extension.
Orange Scenario (Sideways-to-Bullish Consolidation)
This scenario becomes increasingly likely if SOL remains range-bound between $153.50 and $157.80. This consolidation zone overlays the 50–61.8% Fibonacci levels, Bollinger Band basis, and several key trendline intersections. With RSI holding in the 55–65 range and PVT stable, this setup would favor re-accumulation before another breakout attempt. Price action above $155 continues to support this scenario as the base case.
Red Scenario (Bearish Breakdown)
A breakdown below $153.50, especially if followed by a breach of $150 on high sell volume, would invalidate the bullish thesis. This scenario opens downside risk toward $147.35 and potentially $144.00–$140.00. RSI would likely drop below 50, and a flattening or declining PVT would confirm distribution. This path aligns with the broader red trendline and would indicate a rejection of the recent bullish breakout.
Indicators Used:
Bollinger Bands (BB 20, 2)
Relative Strength Index (RSI 14) with moving average overlay
Price Volume Trend (PVT)
Auto-generated trendlines
Harmonic Patterns (ABCD and XABCD)
Fibonacci Retracement and extension levels
Bias:
Short-term bullish if price holds above $155. Market structure, RSI, and PVT favor upward continuation or consolidation. A break below $153.50 would shift the bias toward neutral or bearish.
Strategy Outline:
Bullish if price breaks and holds above $156.50
Targets: $160 / $165 / $172
Bearish if price breaks below $150.00
Targets: $147.35 / $144.00 / $140.00
Scalping opportunity in the $153.50–$157.80 zone while awaiting directional confirmation
**This analysis is for informational and educational purposes only and does not constitute financial or investment advice. Trading cryptocurrencies involves significant risk and may not be suitable for all investors. Always conduct your own research and consult with a licensed financial advisor before making trading decisions. The author is not responsible for any losses incurred from reliance on this analysis.**
Related publications
Disclaimer
The information and publications are not meant to be, and do not constitute, financial, investment, trading, or other types of advice or recommendations supplied or endorsed by TradingView. Read more in the Terms of Use.
Related publications
Disclaimer
The information and publications are not meant to be, and do not constitute, financial, investment, trading, or other types of advice or recommendations supplied or endorsed by TradingView. Read more in the Terms of Use.