After retracing up toward the 50% Fib level (around 154.3–154.4 on the daily chart), SOL/USDT has now stalled beneath key resistance and is rolling back into the reaction range. A close look at both the 1D and 2H charts reveals a clear case of a failed swing high rather than a trend reversal.
1. Structural Context
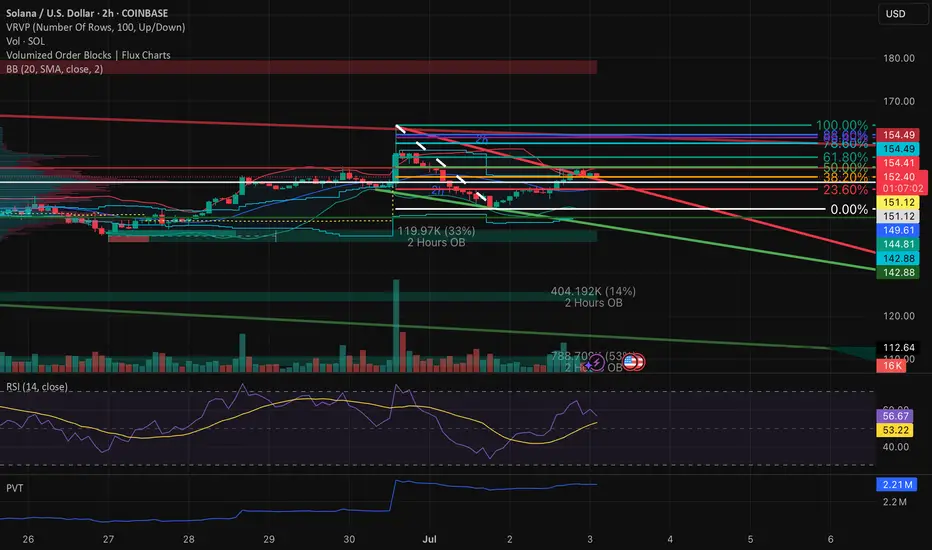
SOL remains inside its broader downtrend channel (green lines). The bounce off the June low carved out a higher low, but the subsequent rally ran into:
The daily descending trendline (red) from the June high
The 50% Fib retracement of the June down-leg (154.3–154.4)
A sell-side order block (red volume bars on the left VPVR)
The daily 20-period SMA and upper Bollinger Band
Because price could not clear these layers, the move shows the characteristics of a lower high inside a downtrend rather than a genuine breakout.
2. Multi-Timeframe Confirmation
Daily (1D) Chart
Retracement: Peaked at 50% Fib then reversed.
Volume Profile: Thick VPVR node at 154–156 acted as a supply shelf.
Bollinger Bands: Upper band contained the rally.
RSI: Pulled back from ~55 and printed a lower high as price challenged 50%.
PVT: Flat, indicating no real net buying during the bounce.
2-Hour (2H) Chart
Trendlines: A shorter-term red downtrend line capped the local rally near 154.
Order Blocks: Green buy-block around 137–140 held the low; red sell-block around 154–157 limited upside.
RSI: Printed a lower high on the second leg up, even as price revisited prior highs.
Volume: Tapered off on the approach into the 50% Fib zone, then increased on the pullback — a sign of distribution.
3. Key Levels & Next Moves
Immediate Support:
152.2–152.5 (38.2% Fib)
151.1–151.9 (23.6% Fib & daily BB midline)
Structural Support Zones:
146.1–144.6 (prior consolidation & lower Bollinger band)
141.5–140.9 (secondary order block)
134.0–137.0 (major demand cluster)
Immediate Resistance:
154.3–154.4 (50% Fib + daily trendline + SMA)
156–158 (78.6–100% Fib band + higher-timeframe supply)
If SOL fails to hold 152.2–152.5, look for a retest of the 146–144 zone. A breach below 144 opens the path back toward the 137–134 order block. Conversely, a sustained reclaim of 154.4 on volume would be needed to shift the short-term bias neutral.
4. Conclusion
This sequence—bounce into 50% Fib, capped by overlapping resistance, followed by divergence in momentum and rising volume on the pullback—confirms another lower high in SOL’s downtrend. Until price can clear 154.4 with conviction, the path of least resistance remains downward.
1. Structural Context
SOL remains inside its broader downtrend channel (green lines). The bounce off the June low carved out a higher low, but the subsequent rally ran into:
The daily descending trendline (red) from the June high
The 50% Fib retracement of the June down-leg (154.3–154.4)
A sell-side order block (red volume bars on the left VPVR)
The daily 20-period SMA and upper Bollinger Band
Because price could not clear these layers, the move shows the characteristics of a lower high inside a downtrend rather than a genuine breakout.
2. Multi-Timeframe Confirmation
Daily (1D) Chart
Retracement: Peaked at 50% Fib then reversed.
Volume Profile: Thick VPVR node at 154–156 acted as a supply shelf.
Bollinger Bands: Upper band contained the rally.
RSI: Pulled back from ~55 and printed a lower high as price challenged 50%.
PVT: Flat, indicating no real net buying during the bounce.
2-Hour (2H) Chart
Trendlines: A shorter-term red downtrend line capped the local rally near 154.
Order Blocks: Green buy-block around 137–140 held the low; red sell-block around 154–157 limited upside.
RSI: Printed a lower high on the second leg up, even as price revisited prior highs.
Volume: Tapered off on the approach into the 50% Fib zone, then increased on the pullback — a sign of distribution.
3. Key Levels & Next Moves
Immediate Support:
152.2–152.5 (38.2% Fib)
151.1–151.9 (23.6% Fib & daily BB midline)
Structural Support Zones:
146.1–144.6 (prior consolidation & lower Bollinger band)
141.5–140.9 (secondary order block)
134.0–137.0 (major demand cluster)
Immediate Resistance:
154.3–154.4 (50% Fib + daily trendline + SMA)
156–158 (78.6–100% Fib band + higher-timeframe supply)
If SOL fails to hold 152.2–152.5, look for a retest of the 146–144 zone. A breach below 144 opens the path back toward the 137–134 order block. Conversely, a sustained reclaim of 154.4 on volume would be needed to shift the short-term bias neutral.
4. Conclusion
This sequence—bounce into 50% Fib, capped by overlapping resistance, followed by divergence in momentum and rising volume on the pullback—confirms another lower high in SOL’s downtrend. Until price can clear 154.4 with conviction, the path of least resistance remains downward.
Disclaimer
The information and publications are not meant to be, and do not constitute, financial, investment, trading, or other types of advice or recommendations supplied or endorsed by TradingView. Read more in the Terms of Use.
Disclaimer
The information and publications are not meant to be, and do not constitute, financial, investment, trading, or other types of advice or recommendations supplied or endorsed by TradingView. Read more in the Terms of Use.