1. Main Trend
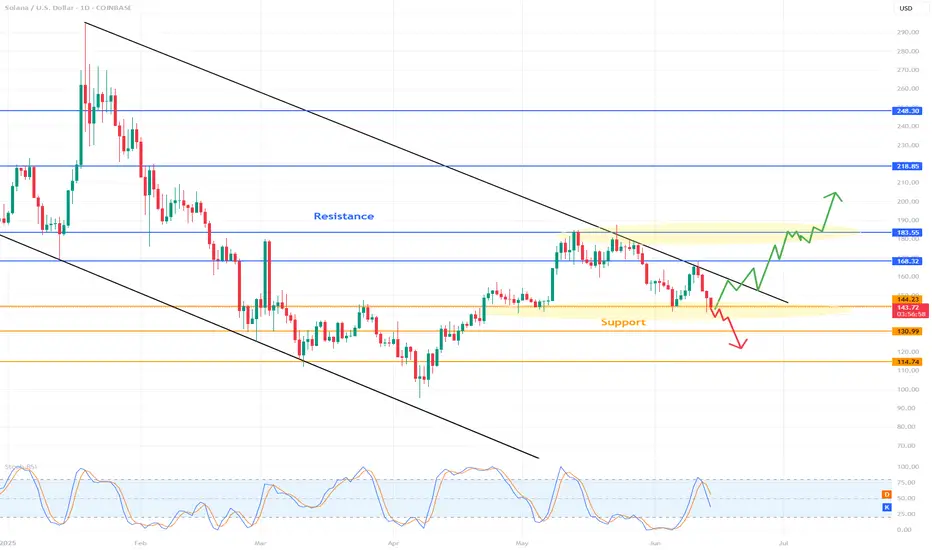
Downward Channel: Price moving in wide, downward channels (black trend lines), which means that the medium and long term remains bearish.
The upper trend line is a strong dynamic resistance, the lower one – support.
2. Key Horizontal
Resistance (Resistance):
$168.32: Strong resistance level, which it has responded to many times in the past.
$183.55: Another important resistance, confirmed by historical highs.
$218.85: Further resistance with an interval obligation.
$248.30: Very strong, long-term resistance (far from the current price for now).
Support (Support):
$144.23: actually occurs close to this support – very level.
$130.99: Another potential level where price could look for a rebound.
$114.74: Strong support, last bastion of bulls near March/April low.
3. Price action (Price action)
Last candles emitted pullback from downtrend line and down to support area of $144.23.
that any attempt to grow above trend line is limited by sellers.
$144.23 level currently existing short-term support - its loss may be available in case of $131 or possibly existing.
4. Indicator
Stochastic RSI (at the bottom of the chart):
Stochastic RSI indicator stated that airlines (blue and orange) were in power (overbought) in recent devices, but suddenly started to turn down.
Currently occurs in neutral zone, however application of protection (oversold). In case of threat occurrence now, it may suggest risk of attack, but it is not yet decided.
It is worth noting whether to go to the area of 20 and start turning back - in case of a necessary necessity.
5. Scenarios for the days
Bullish (growth):
Maintaining support at 144.23 USD and hitting the downtrend line (around 160-165 USD).
Breaking the trend line and resistance at 168.32 USD will give a signal to load in the area of 183-218 USD, but for the tenth time it seems to be less important, attention given the market structure.
Bearish (fall):
Breaking support at 144.23 USD and closing below on the daily candle - the next target to 131 USD, and then 114 USD.
The downtrend channel is still working against the bulls.
6. Summary
Main trend: downtrend.
Price: Close to support, but the risk of you leaving a big one.
Key horizontals: $144.23 (short-term support), $168.32 (main resistance).
Stochastic RSI: Heading towards oversold zone, but not yet giving a clear conclusion about a breakout.
Recommendation: Observe the application of price at $144.23 and the behavior of Stochastic RSI. In case of a breakout - it is possible that they will occur.
Disclaimer
The information and publications are not meant to be, and do not constitute, financial, investment, trading, or other types of advice or recommendations supplied or endorsed by TradingView. Read more in the Terms of Use.
Disclaimer
The information and publications are not meant to be, and do not constitute, financial, investment, trading, or other types of advice or recommendations supplied or endorsed by TradingView. Read more in the Terms of Use.