Solana bullish momentum is building up from both technical and fundamental perspectives.
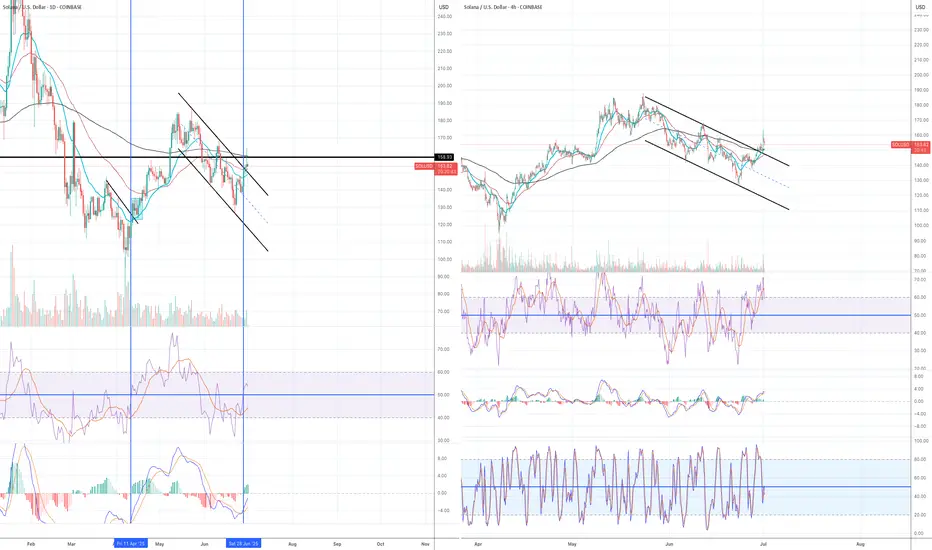
Daily chart:
1) A daily candle decisively moved and closed above EMA21 on Sat 28th June.
2) RSI and MACD are still in the bear zone but the lines are crossed and now moving upwards.
3) RSI line is now above 50. When the RSI line moves above 50 and EMA21 closes above 21 at the same time, it is often (not always) an early sign of bullish momentum (see blue vertical lines in daily chart).
4H chart:
1) EMA21>EMA55, but EMA200 is still moving horizontally.
2) All momentum indicators have entered the bull territory. However, when the candle finally broke outside the descending parallel channel and broke and closed above EMA200, momentum indicators reached the overbought territory. It means the price is likely to consolidate first before taking off.
I plan to open a long position when:
1) Wait for the momentum indicators to come down and flip to the upside in the 4H chart.
2) A candle to retest, either EMA 21, 55 and/or 200 and forms a strong green (bullish) candle in the 4H chart.
3) A candle stays above EMA 21 in the 4H chart.
Related publications
Disclaimer
The information and publications are not meant to be, and do not constitute, financial, investment, trading, or other types of advice or recommendations supplied or endorsed by TradingView. Read more in the Terms of Use.
Related publications
Disclaimer
The information and publications are not meant to be, and do not constitute, financial, investment, trading, or other types of advice or recommendations supplied or endorsed by TradingView. Read more in the Terms of Use.