My overall bias for Solana is bullish. Currently I only own the underlying asset, but I have been waiting for the right set up to arrive to open a leveraged long position.
The way I am looking at the market right now:
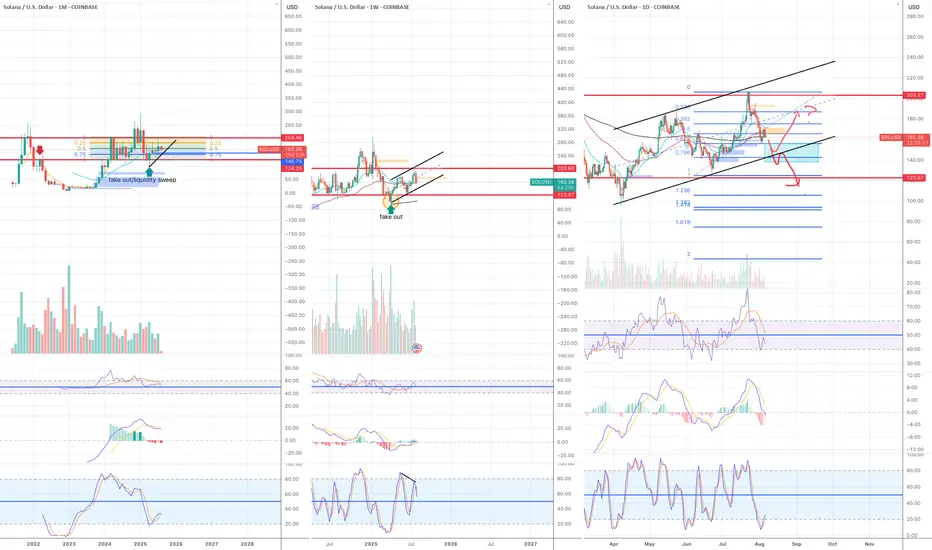
Monthly chart:
In the last crypto cycle, Solana reached ATH in Nov 2021 and started to enter the macro bear trend. The price dropped sharply from $260 to $75 in the matter of three months. The price temporarily bounced up to $125 approx. (Red horizontal line in the chart) but it was a dead cat bounce. It failed to move above it and it was the beginning of the official bear market.
When you look at the price action of the last 18 months in a monthly chart, the price has been mostly moving between $125 and $205. However, the price wicked down to $96 in April this year. Since then the price is forming higher high higher low despite messy price action.
Both RSI and MACD are in the bull territory but they are slowly rolling to the downside. Stochastic on the other hand reached oversold territory and is now moving to the upside.
As long as RSI and MACD stay in the bull zone, the current price move is a corrective one.
Currently the price is sitting in the middle of the range bound of the last 18th months.
Weekly chart:
Price is trapped in the range bound and also is the ascending parallel channel.
EMA21 and 55 are bunched up together and running horizontally.
RSI is trapped in the 40-60 range and sliding across.
MACD is tilting to the upside but failed to enter the bull zone.
Stochastic is showing bearish negative divergence.
Base on all the indicators and price action in the weekly chart tell me the price is in a slow decline, but it is more like a tight sideway consolidation.
Daily chart:
EMA21> EMA 55> EMA200 - bullish but not perfect
EMA 200 is dead horizontal and a today's daily candle is sitting on EMA200.
MACD is entering the bear zone. MACD line is about to enter the bear zone. But the stochastic reached oversold territory and now is moving to the upside.
Conclusion:
My number one rule of trading is I stay away from trading when EMA200 is dead flat and the price is oscillating around it. I have lost money numerous times by trying to guess which way the price will move. No point of front running when EMA200 is flat. The price will break out eventually but I need to wait for a clear direction to emerge.
As I wrote in my previous articles. I think the current price move is a corrective one. The price will eventually move to the upside but I have no idea when. What I am focusing on now is to watch where the price will retrace to before it takes off in the daily chart. It may not take off, so I just want to wait and see.
There are a few fair value gap in the Fib 0.618 and 0.786 zone (blue rectangular box) and it is also where the ascending trendline intersects. So it is possible for the price to move further down to that area.
The way I am looking at the market right now:
Monthly chart:
In the last crypto cycle, Solana reached ATH in Nov 2021 and started to enter the macro bear trend. The price dropped sharply from $260 to $75 in the matter of three months. The price temporarily bounced up to $125 approx. (Red horizontal line in the chart) but it was a dead cat bounce. It failed to move above it and it was the beginning of the official bear market.
When you look at the price action of the last 18 months in a monthly chart, the price has been mostly moving between $125 and $205. However, the price wicked down to $96 in April this year. Since then the price is forming higher high higher low despite messy price action.
Both RSI and MACD are in the bull territory but they are slowly rolling to the downside. Stochastic on the other hand reached oversold territory and is now moving to the upside.
As long as RSI and MACD stay in the bull zone, the current price move is a corrective one.
Currently the price is sitting in the middle of the range bound of the last 18th months.
Weekly chart:
Price is trapped in the range bound and also is the ascending parallel channel.
EMA21 and 55 are bunched up together and running horizontally.
RSI is trapped in the 40-60 range and sliding across.
MACD is tilting to the upside but failed to enter the bull zone.
Stochastic is showing bearish negative divergence.
Base on all the indicators and price action in the weekly chart tell me the price is in a slow decline, but it is more like a tight sideway consolidation.
Daily chart:
EMA21> EMA 55> EMA200 - bullish but not perfect
EMA 200 is dead horizontal and a today's daily candle is sitting on EMA200.
MACD is entering the bear zone. MACD line is about to enter the bear zone. But the stochastic reached oversold territory and now is moving to the upside.
Conclusion:
My number one rule of trading is I stay away from trading when EMA200 is dead flat and the price is oscillating around it. I have lost money numerous times by trying to guess which way the price will move. No point of front running when EMA200 is flat. The price will break out eventually but I need to wait for a clear direction to emerge.
As I wrote in my previous articles. I think the current price move is a corrective one. The price will eventually move to the upside but I have no idea when. What I am focusing on now is to watch where the price will retrace to before it takes off in the daily chart. It may not take off, so I just want to wait and see.
There are a few fair value gap in the Fib 0.618 and 0.786 zone (blue rectangular box) and it is also where the ascending trendline intersects. So it is possible for the price to move further down to that area.
Related publications
Disclaimer
The information and publications are not meant to be, and do not constitute, financial, investment, trading, or other types of advice or recommendations supplied or endorsed by TradingView. Read more in the Terms of Use.
Related publications
Disclaimer
The information and publications are not meant to be, and do not constitute, financial, investment, trading, or other types of advice or recommendations supplied or endorsed by TradingView. Read more in the Terms of Use.