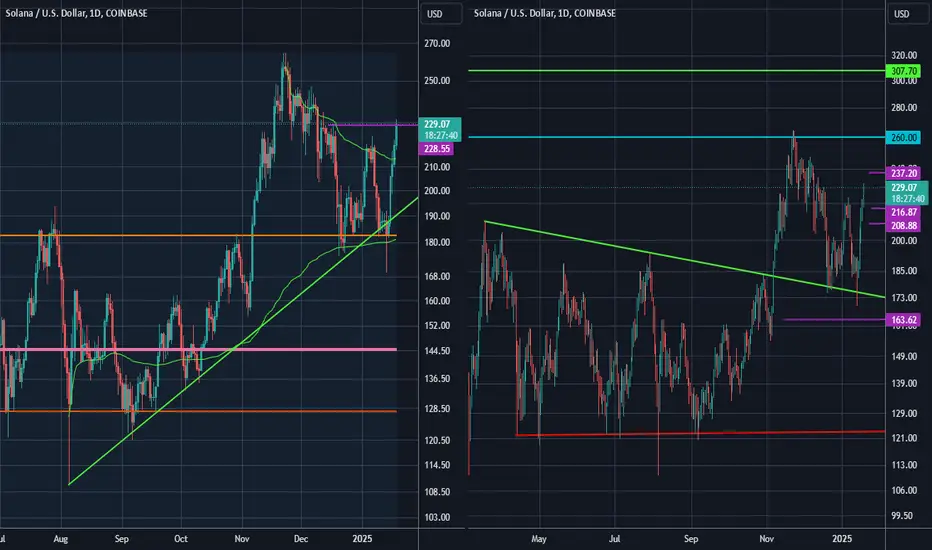
SOL left daily chart shows price bounced off anchored vwap (green thin line) and the green trendline as well as the VAH. It went through anchored vwap from the top and is touching a naked POC currently.
Right chart shows support levels below and resistance levels above with the green horizontal line the target.
Don't forget to smash the rocket like button!
Right chart shows support levels below and resistance levels above with the green horizontal line the target.
Don't forget to smash the rocket like button!
Follow me on Youtube, X and in Discord server for more updates more frequently.
Related publications
Disclaimer
The information and publications are not meant to be, and do not constitute, financial, investment, trading, or other types of advice or recommendations supplied or endorsed by TradingView. Read more in the Terms of Use.