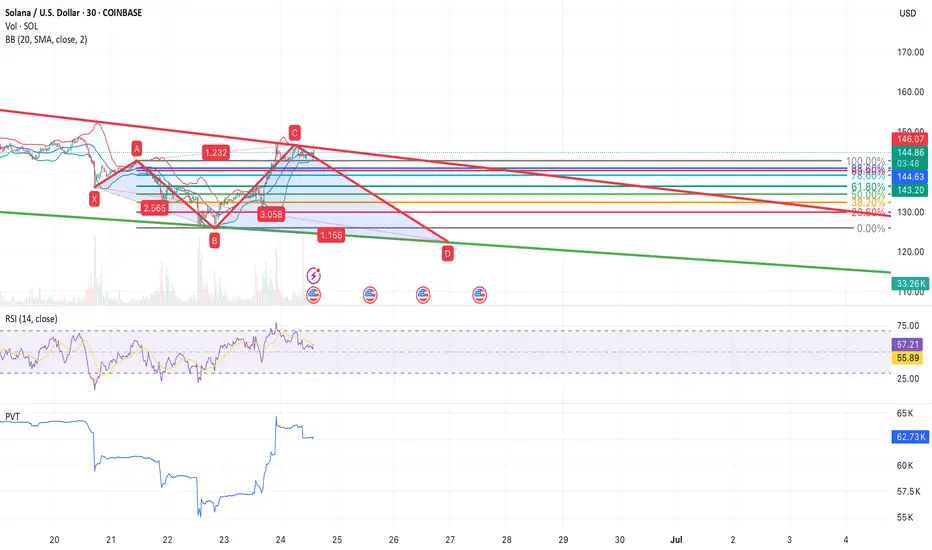
The 2H chart shows an extended X‑A‑B‑C‑D harmonic structure (an extended Bat/ABCD). Leg XA was the initial down-leg (from the recent swing high down to A), AB was a corrective pullback, and BC retraces sharply into the 88.6–100% zone of XA (around $144–$145). In a classic Bat/ABCD, the CD leg often completes near an 88.6% retracement of XA, so this C zone is a potential reversal point (PRZ). Importantly, C also sits on the chart’s long-term red descending trendline – a confluence of fib and trendline. A break below this level would “validate the bearish harmonic pattern,” with the downtrend line amplifying selling pressure. The projected D-point is ~$122.63 (late June/early July), which coincides with the lower green channel support on the chart.
Harmonic pattern (2H SOL/USDT): XA and AB moves set up a deep BC up into the 88.6–100% fib zone (around $144–145) at C. This confluence of fib levels and the macro descending trendline makes C a strong Potential Reversal Zone (PRZ). The CD leg targets ~122.63, aligning with lower channel support (green). Across timeframes the momentum is waning into point C. RSI is rolling over – price made a lower high while RSI failed to confirm (a classic bearish divergence). Meanwhile, the PVT (Price Volume Trend) line has flattened even as price crept higher, indicating the rally is not supported by volume.
Volume patterns also signal distribution: rallies into C have occurred on declining volume, a textbook sign that buying interest is drying up. Wyckoff distribution theory notes that as a top forms, “rallies during this stage often show lower volume” and ensuing drops on higher volume. In short, weakening RSI, a flat PVT, and thinning volume all confirm the selling pressure around $144–$145, consistent with a bearish reversal at C. Momentum and volume (15m SOL/USDT): RSI has peaked lower while price nears $145, and PVT has flattened (highlighted). Rallies into C come on lower volume, matching Wyckoff distribution cues. These divergences suggest the upward move into C is exhausted.
Trade Plan & Risk Management
Entry: Short initiated at $145.00 (near the PRZ around C).
Stop Loss: $146.20 (just above the red trendline and invalidation of point C).
Take Profit Targets:
TP1: $129.00 (minor fib support, ~61.8% retrace of the last swing).
TP2: $122.63 (harmonic D projection and channel support).
TP3: $120.00 (extension to lower channel boundary).
Confirmation: Watch for a break of the short-term support at ~$139.50 for added conviction before letting profits run.
Note: A short position was opened at $145. This outline is for informational purposes – it is not financial advice. Trade with proper risk management.
Each target corresponds to technical levels (fib retracements and channel support). The first target aligns with a ~61.8% retracement (common fib TP level), and the final targets sit on the longer-term channel floor. If price breaks under $139.50, it would further confirm the bearish thesis.
Trade active
The initial stop loss at 146.20 was too conservative and has now been triggered, resulting in a minor loss of ~0.8% from the $145 entry. However, the overall structure and bearish thesis remain valid — price continues to respect the harmonic reversal zone and macro resistance.A more suitable stop loss range, given current volatility and wick behavior, would be $148 to $151, which accounts for:
Extended retests of the upper trendline
100%+ retracement of the XA leg (common in harmonic traps)
Price expansion zones during failed breakouts
This adjusted stop range reflects a potential drawdown of 2.1% to 4.1% from the original $145 entry.
Key targets remain unchanged:
TP1: $129
TP2: $122.63
TP3: $120
Traders considering re-entry should wait for momentum confirmation — such as a clean rejection below $147 or a breakdown of $139.50 — before scaling back into the short.
Disclaimer
The information and publications are not meant to be, and do not constitute, financial, investment, trading, or other types of advice or recommendations supplied or endorsed by TradingView. Read more in the Terms of Use.
Disclaimer
The information and publications are not meant to be, and do not constitute, financial, investment, trading, or other types of advice or recommendations supplied or endorsed by TradingView. Read more in the Terms of Use.