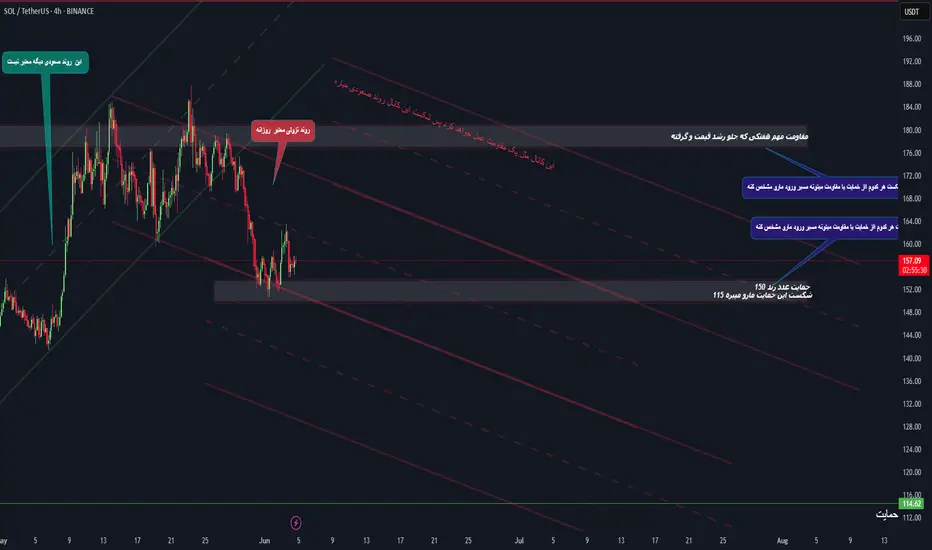
On the 4H chart of Solana (SOL), the price has broken out of a temporary bullish trend and entered a clearly defined descending channel.
🔸 The major resistance around $164–$172 could limit further upside in the short term.
🔸 A confirmed breakdown below the $150 support may lead to a deeper correction toward the $115 zone.
🔸 The descending channel is currently guiding price action, and reactions to its midline and upper boundary will determine the next major move.
🔸 The analysis distinguishes between short-term impulses and the dominant daily downtrend, helping identify potential trade setups.
📌 This analysis is for educational purposes only.
Disclaimer
The information and publications are not meant to be, and do not constitute, financial, investment, trading, or other types of advice or recommendations supplied or endorsed by TradingView. Read more in the Terms of Use.
Disclaimer
The information and publications are not meant to be, and do not constitute, financial, investment, trading, or other types of advice or recommendations supplied or endorsed by TradingView. Read more in the Terms of Use.