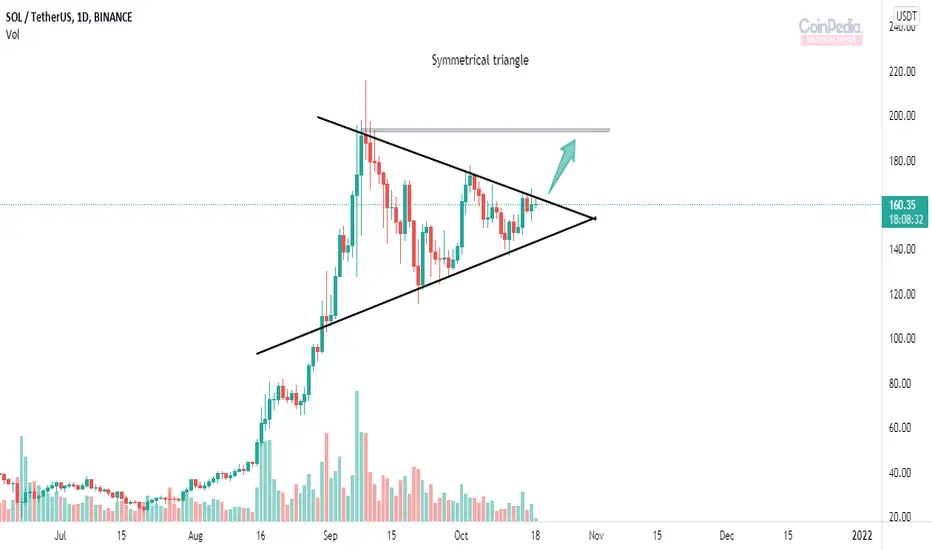
* Solana in 1D time frame forms a Symmetrical triangle
* Symmetrical triangle appears when the price consolidates between two trend-lines slightly sloping towards each other.
* Here the below Ascending trendline works as support for the price and the above Descending trendline as resistance
* If SOL breaks the above trendline we can see continuation of the trend.
Trade closed: target reached
Disclaimer
The information and publications are not meant to be, and do not constitute, financial, investment, trading, or other types of advice or recommendations supplied or endorsed by TradingView. Read more in the Terms of Use.
Disclaimer
The information and publications are not meant to be, and do not constitute, financial, investment, trading, or other types of advice or recommendations supplied or endorsed by TradingView. Read more in the Terms of Use.