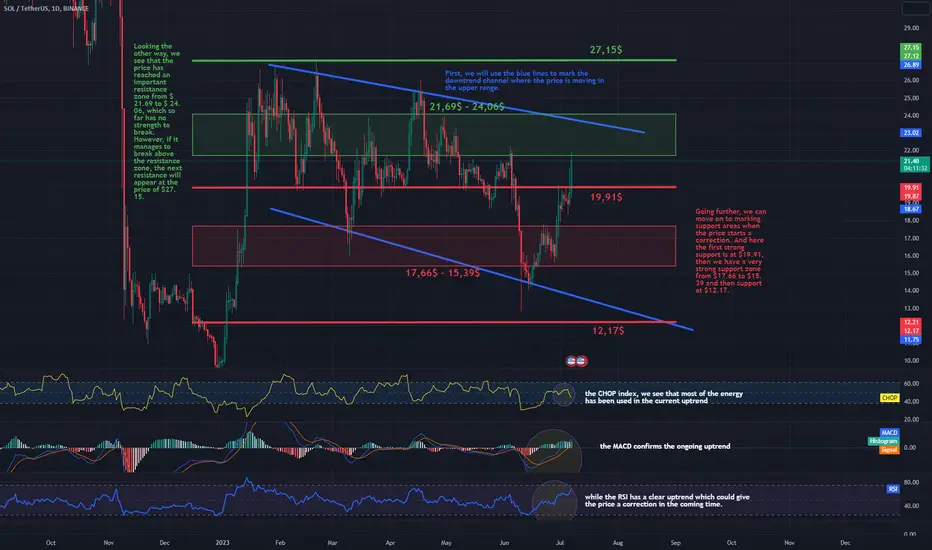
Hello everyone, I invite you to review the SOL chart in pair to USDT. First, we will use the blue lines to mark the downtrend channel where the price is moving in the upper range.
Going further, we can move on to marking support areas when the price starts a correction. And here the first strong support is at $19.91, then we have a very strong support zone from $17.66 to $15.39 and then support at $12.17.
Looking the other way, we see that the price has reached an important resistance zone from $ 21.69 to $ 24.06, which so far has no strength to break. However, if it manages to break above the resistance zone, the next resistance will appear at the price of $27.15.
Please take a look at the CHOP index, we see that most of the energy has been used in the current uptrend, the MACD confirms the ongoing uptrend, while the RSI has a clear uptrend which could give the price a correction in the coming time.
Disclaimer
The information and publications are not meant to be, and do not constitute, financial, investment, trading, or other types of advice or recommendations supplied or endorsed by TradingView. Read more in the Terms of Use.
Disclaimer
The information and publications are not meant to be, and do not constitute, financial, investment, trading, or other types of advice or recommendations supplied or endorsed by TradingView. Read more in the Terms of Use.