🔹 Trend direction
Current short-term trend: down
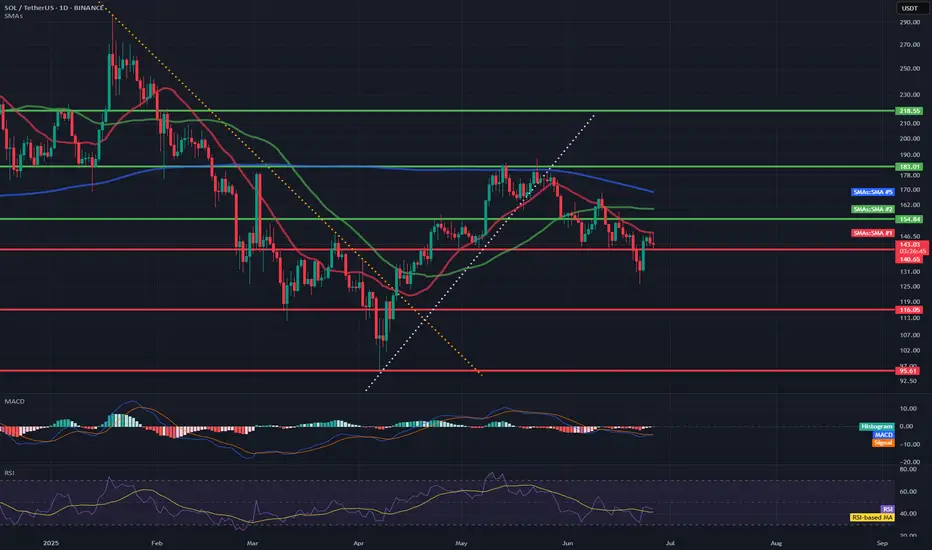
Price below key moving averages:
SMA50 (green) ≈ 154.84
SMA200 (blue) ≈ 168.79
Price ≈ 142.49 – below both, confirming weakness.
🔹 Supports and resistances (key levels)
✅ Supports:
142.00–143.50 – current level where price is struggling (multiple price reactions).
131.00 – strong support, last low (June 18).
119.00 / 116.00 / 113.00 – next supports from previous consolidations.
95.61 – deep support if market breaks down.
❌ Resistances:
148.00–150.00 – local resistance, coinciding with the red SMA (short-term resistance).
154.84 – resistance (SMA50).
162.00 – resistance (SMA200).
183.00 – main resistance from the May peak.
218.55 – very strong resistance from March.
🔹 Technical indicators
📉 MACD:
MACD line < signal, negative histogram → bearish signal.
No signs of bullish strength.
📉 RSI:
RSI ≈ 41.31 – close to the oversold zone, but not there yet (below 30).
RSI trend also downward.
🔹 Formations and trend lines
Broken support line after the April-May bullish structure (white trend line).
The previous bearish trend line (yellow) was broken in April, but the momentum did not hold.
A lower high and lower low may be forming now – a classic bearish structure.
🔹 Potential scenarios
🔻 Bearish:
Breakout of 142 → test of 131 → possible drop to 119/116.
Staying below SMA50 and MACD still negative = high chance of continuing declines.
🔼 Bullish:
Recovery of 148–150 needed → only then a chance to test 154 and SMA50.
RSI close to oversold = possible local technical bounce, but not reversing the trend.
📌 Conclusions / Summary
General trend: Bearish (down).
Sentiment: Negative, no confirmed signals of strength.
If level 142 breaks - next test will be at 131.
A strong breakout above 150-154 is needed to talk about a change in structure.
Current short-term trend: down
Price below key moving averages:
SMA50 (green) ≈ 154.84
SMA200 (blue) ≈ 168.79
Price ≈ 142.49 – below both, confirming weakness.
🔹 Supports and resistances (key levels)
✅ Supports:
142.00–143.50 – current level where price is struggling (multiple price reactions).
131.00 – strong support, last low (June 18).
119.00 / 116.00 / 113.00 – next supports from previous consolidations.
95.61 – deep support if market breaks down.
❌ Resistances:
148.00–150.00 – local resistance, coinciding with the red SMA (short-term resistance).
154.84 – resistance (SMA50).
162.00 – resistance (SMA200).
183.00 – main resistance from the May peak.
218.55 – very strong resistance from March.
🔹 Technical indicators
📉 MACD:
MACD line < signal, negative histogram → bearish signal.
No signs of bullish strength.
📉 RSI:
RSI ≈ 41.31 – close to the oversold zone, but not there yet (below 30).
RSI trend also downward.
🔹 Formations and trend lines
Broken support line after the April-May bullish structure (white trend line).
The previous bearish trend line (yellow) was broken in April, but the momentum did not hold.
A lower high and lower low may be forming now – a classic bearish structure.
🔹 Potential scenarios
🔻 Bearish:
Breakout of 142 → test of 131 → possible drop to 119/116.
Staying below SMA50 and MACD still negative = high chance of continuing declines.
🔼 Bullish:
Recovery of 148–150 needed → only then a chance to test 154 and SMA50.
RSI close to oversold = possible local technical bounce, but not reversing the trend.
📌 Conclusions / Summary
General trend: Bearish (down).
Sentiment: Negative, no confirmed signals of strength.
If level 142 breaks - next test will be at 131.
A strong breakout above 150-154 is needed to talk about a change in structure.
Disclaimer
The information and publications are not meant to be, and do not constitute, financial, investment, trading, or other types of advice or recommendations supplied or endorsed by TradingView. Read more in the Terms of Use.
Disclaimer
The information and publications are not meant to be, and do not constitute, financial, investment, trading, or other types of advice or recommendations supplied or endorsed by TradingView. Read more in the Terms of Use.