Solana (SOL) technical analysis:
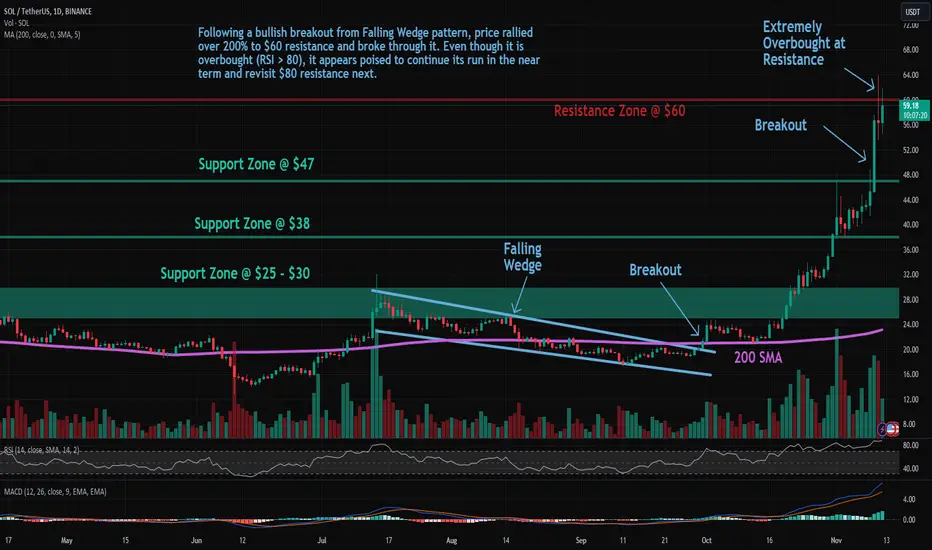
Trade setup: Following a bullish breakout from Falling Wedge pattern, price rallied over 200% to $60 resistance and broke through it. Even though it is overbought (RSI > 80), it appears poised to continue its run in the near term and revisit $80 resistance next.
Trend: Uptrend across all time horizons (Short- Medium- and Long-Term).
Momentum is Bullish but extremely overbought. ( MACD Line is above MACD Signal Line). RSI is bullish (> 55) but extremely overbought (> 80) which could imply that price could briefly pause or pull back if it reaches Resistance.
Support and Resistance: Nearest Support Zone is $47 (previous resistance), then $38. The nearest Resistance Zone is $60.
Disclaimer
The information and publications are not meant to be, and do not constitute, financial, investment, trading, or other types of advice or recommendations supplied or endorsed by TradingView. Read more in the Terms of Use.
Disclaimer
The information and publications are not meant to be, and do not constitute, financial, investment, trading, or other types of advice or recommendations supplied or endorsed by TradingView. Read more in the Terms of Use.