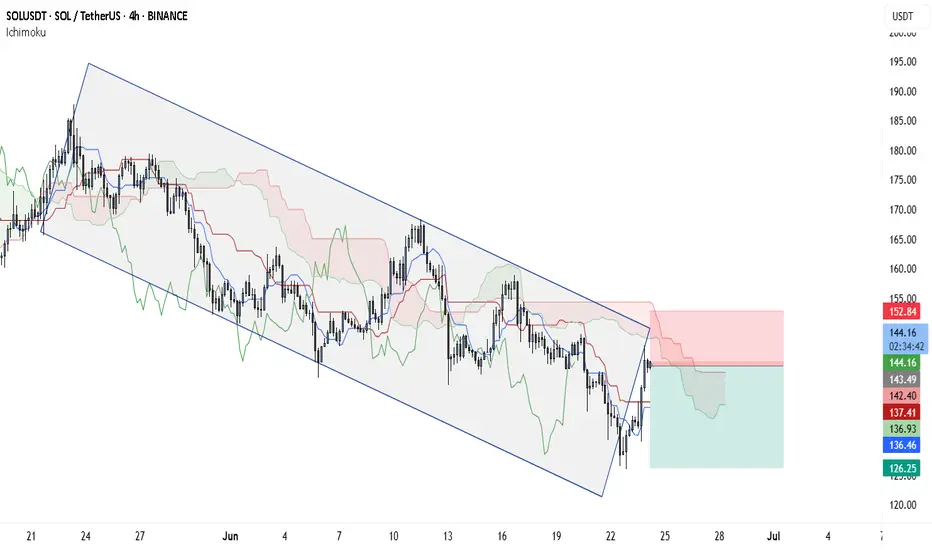
The current SOLUSDT 4-hour chart reflects a strong bearish trend structure, supported by the price consistently respecting a descending channel. This channel has been intact for several weeks, and recent price action shows Solana approaching the upper boundary of this channel once again. Historically, this has acted as a sell zone, and unless there is a confirmed breakout, it remains a high-probability short setup.
Adding to the bearish sentiment is the Ichimoku Cloud. Price is currently trading beneath the cloud, and the cloud itself is shaded red and expanding, signaling ongoing bearish pressure. The Tenkan-sen (conversion line) has just crossed slightly above the price, but the Kijun-sen (base line) sits just above current levels, offering resistance. Most importantly, the Chikou Span (lagging line) is still below both the price and the cloud, which reinforces the idea that momentum remains on the downside.
Within this structure, a clean trade setup emerges:
• Entry: Around $143.87 (Kijun-sen + upper channel area)
• Stop Loss: $152.84 (above the cloud + upper trendline)
• Take Profit 1: $136.46 (mid-channel + local support)
• Take Profit 2: $126.25 (channel bottom)
Given the overall confluence of the bearish channel and Ichimoku resistance, any rejection from the $143–$144 area would support continuation toward the lower bounds of the trend. As always, watch for a strong bearish candle or wick rejection before entering to improve timing.
Trade forex, indices, stocks and metals with up to US$100.000 in company's funding.
Complete a challenge to access funding or go for instant deposit.
Trading involves substantial risk. Not financial advice
Complete a challenge to access funding or go for instant deposit.
Trading involves substantial risk. Not financial advice
Related publications
Disclaimer
The information and publications are not meant to be, and do not constitute, financial, investment, trading, or other types of advice or recommendations supplied or endorsed by TradingView. Read more in the Terms of Use.