Analyzing the SOL/USDT across multiple timeframes, we observe a complex interplay of institutional activities. Starting from the 1D chart, the price action shows a recent recovery from a significant drop, suggesting a potential phase of accumulation or re-accumulation by institutions. The 4H and 1H charts display a series of higher lows, indicating a short-term bullish sentiment and possible preparation for an upward move.
The 15M, 5M, and 1M charts reveal more granular details of this bullish sentiment, with price action forming higher lows and testing previous highs, which could be indicative of a buildup of buying pressure. The presence of wicks on the lower side of candles in these lower timeframes suggests rejection of lower prices, a typical sign of institutional buying interest at those levels.
INSTITUTIONAL THESIS:
Institutions appear to be in a phase of accumulation, particularly noticeable on the 1D and 4H charts where the price has stabilized and started to curve upwards. The higher lows across the 1H, 15M, and 5M charts support this thesis, indicating an ongoing demand at higher price levels. This setup suggests a preparation for a potential upward breakout.
LEARNING POINT:
"1H and 4H higher lows formation amidst a broader 1D accumulation phase."
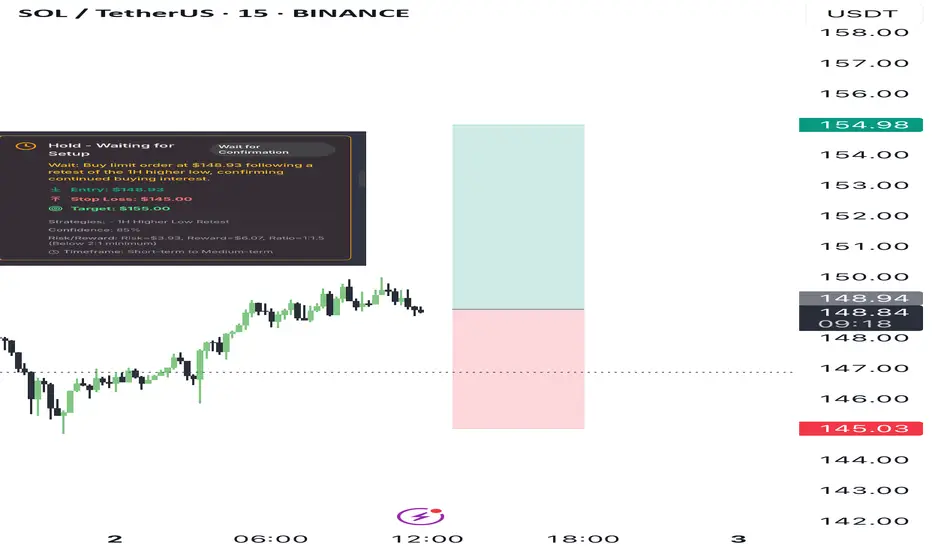
SIGNAL: WAIT
SYMBOL: SOL/USDT
ENTRY PRICE: $148.93
STOP LOSS: $145.00
TARGET PRICE: $155.00
CONDITION: Buy limit order at $148.93 following a retest of the 1H higher low, confirming continued buying interest.
RATIONALE: Calculated risk/reward ratio of 1:1.5 (Risk=$3.93, Reward=$6.07) does not meet minimum 2:1 requirement. Waiting for better institutional setup with improved risk parameters.
Momentum & Exhaustion: Rejection of lower prices on lower timeframes, indicating exhaustion of selling pressure.
Liquidity Behavior: Potential liquidity above recent highs around $150.00, likely target for institutional profit-taking.
Pressure Analysis: Institutional buying evident from wick rejections on lower timeframes.
Context Awareness: Price action moving from a discount (recent lows) towards a premium zone (above $150.00).
STRATEGIES USED:
1H Higher Low Retest
4H Accumulation Phase Buying
Targeting Liquidity above $150.00
The 15M, 5M, and 1M charts reveal more granular details of this bullish sentiment, with price action forming higher lows and testing previous highs, which could be indicative of a buildup of buying pressure. The presence of wicks on the lower side of candles in these lower timeframes suggests rejection of lower prices, a typical sign of institutional buying interest at those levels.
INSTITUTIONAL THESIS:
Institutions appear to be in a phase of accumulation, particularly noticeable on the 1D and 4H charts where the price has stabilized and started to curve upwards. The higher lows across the 1H, 15M, and 5M charts support this thesis, indicating an ongoing demand at higher price levels. This setup suggests a preparation for a potential upward breakout.
LEARNING POINT:
"1H and 4H higher lows formation amidst a broader 1D accumulation phase."
SIGNAL: WAIT
SYMBOL: SOL/USDT
ENTRY PRICE: $148.93
STOP LOSS: $145.00
TARGET PRICE: $155.00
CONDITION: Buy limit order at $148.93 following a retest of the 1H higher low, confirming continued buying interest.
RATIONALE: Calculated risk/reward ratio of 1:1.5 (Risk=$3.93, Reward=$6.07) does not meet minimum 2:1 requirement. Waiting for better institutional setup with improved risk parameters.
Momentum & Exhaustion: Rejection of lower prices on lower timeframes, indicating exhaustion of selling pressure.
Liquidity Behavior: Potential liquidity above recent highs around $150.00, likely target for institutional profit-taking.
Pressure Analysis: Institutional buying evident from wick rejections on lower timeframes.
Context Awareness: Price action moving from a discount (recent lows) towards a premium zone (above $150.00).
STRATEGIES USED:
1H Higher Low Retest
4H Accumulation Phase Buying
Targeting Liquidity above $150.00
Disclaimer
The information and publications are not meant to be, and do not constitute, financial, investment, trading, or other types of advice or recommendations supplied or endorsed by TradingView. Read more in the Terms of Use.
Disclaimer
The information and publications are not meant to be, and do not constitute, financial, investment, trading, or other types of advice or recommendations supplied or endorsed by TradingView. Read more in the Terms of Use.