SOL/USD 1H Chart Analysis
🚀 Follow me on Tradingview if you respect our charts 📈
Current Price: $235
Market Structure:
Smart Money Analysis:
Key Levels:
Trade Setup (Confidence Level: 8/10):
Recommendation:
🚀 Follow me on Tradingview if you respect our charts 📈
🚀 Follow me on Tradingview if you respect our charts 📈
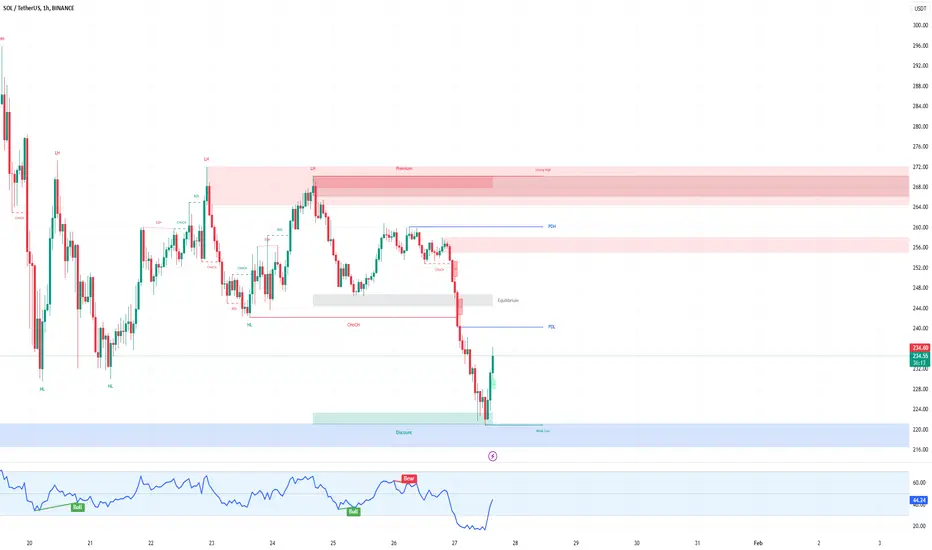
Current Price: $235
Market Structure:
- Bearish momentum after breaking key support at $244.
- Potential bottoming formation visible at current levels.
Smart Money Analysis:
- Accumulation Zone: $220-$230 with heavy institutional volume.
- RSI: Hidden bullish divergence forming (lower lows in price, higher lows in RSI).
- Market makers appear to be accumulating for the next upward move.
Key Levels:
- Resistance: $244, $252, $268.
- Support: $220, $228.
Trade Setup (Confidence Level: 8/10):
- Entry Zone: $232-$235.
- Targets:
- T1: $244
- T2: $252
- T3: $268
- Stop Loss: Below $220 (accumulation zone).
- Risk Score: 6/10 (moderate risk due to market volatility).
Recommendation:
- Long position recommended with tight risk management.
- Watch for confirmation above $238 to increase confidence in bullish continuation.
- Volume and price action at $244 will be key to determining the strength of the breakout.
- Confidence Level: 8/10 for bullish reversal potential.
🚀 Follow me on Tradingview if you respect our charts 📈
Disclaimer
The information and publications are not meant to be, and do not constitute, financial, investment, trading, or other types of advice or recommendations supplied or endorsed by TradingView. Read more in the Terms of Use.
Disclaimer
The information and publications are not meant to be, and do not constitute, financial, investment, trading, or other types of advice or recommendations supplied or endorsed by TradingView. Read more in the Terms of Use.