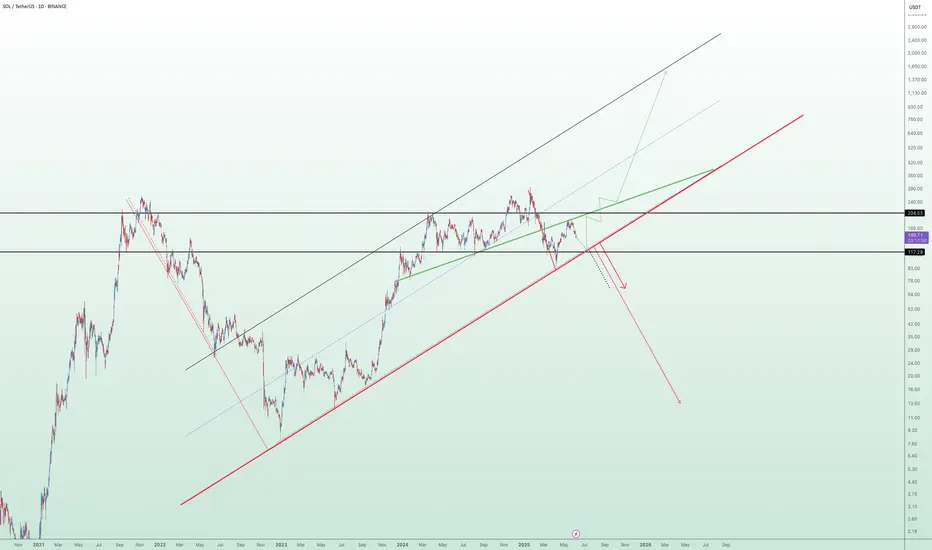
The chart illustrates a long-term technical structure where the price has been following an ascending channel after a prolonged bearish trend. However, recent price action indicates a breakdown below the green ascending trendline, raising concerns about a potential shift in market sentiment.
Currently, the $117 level is acting as a pivotal support zone. A sustained breakdown below this level — and more critically, below the red lower trendline — would validate the bearish scenario. This could trigger a deeper correction phase, with downside targets aligned along the red projection path. Such a move may lead to significantly lower price levels in the medium to long term.
🔽 Bearish Scenario:
If the price fails to hold above $117 and breaks below the red trendline, this would confirm the start of a bearish leg. Based on historical structure and projected trajectories, this could result in a descent toward the $93 level initially, with the possibility of extending further downward depending on market conditions.
🔼 Bullish Scenario:
On the other hand, if the price manages to reclaim the green trendline and more importantly, stabilize above the $204 resistance zone, it would signal renewed bullish strength. Such a move would open the path toward higher highs, potentially re-entering the previous upward channel and continuing the macro uptrend.
🧭 The price structure is now approaching a decisive zone, where either a confirmation of bearish continuation or a bullish recovery will likely unfold. Both scenarios have been visually outlined — green lines indicating bullish continuation, and red lines representing bearish momentum.
📌 Note: This analysis is for educational purposes only and should not be interpreted as financial advice.
Trade active
📉 Solana – Triple Rejection & Breakdown RiskSolana has faced three consecutive rejections from the green ascending trendline, especially near the 175–180 resistance area, showing growing weakness in bullish structure. Price has repeatedly attempted to regain its previous uptrend, but each time it was rejected precisely at the green trendline, failing to reclaim control. This is a significant technical signal suggesting a potential deeper correction.
The 117.29 level is now a crucial pivot, as it represents the confluence of the long-term dynamic ascending trendline (red) and the horizontal static support (black). A decisive break below this zone would likely confirm the start of a major bearish phase, possibly targeting sub-$50 areas. The red schematic on the chart outlines this realistic scenario, even accounting for a fake recovery before a steep drop.
That said, no confirmation has formed yet. This entire structure might be a trap to shake out buyers, only to flip direction later this month. Until price clearly breaks out of the zone marked on the chart, waiting with patience is critical.
🔻 Risk Level: Medium–High
📍 Key Support: 117.29
📍 Resistance Levels: 143
🎯 Breakdown Targets: 65 – 38 – 25
🎯 Recovery Scenario: 175 → 204
🔎 Bias: Bearish, waiting for confirmation
Disclaimer
The information and publications are not meant to be, and do not constitute, financial, investment, trading, or other types of advice or recommendations supplied or endorsed by TradingView. Read more in the Terms of Use.
Disclaimer
The information and publications are not meant to be, and do not constitute, financial, investment, trading, or other types of advice or recommendations supplied or endorsed by TradingView. Read more in the Terms of Use.