Hi everyone,
Let's take a look at the SOL / USDT chart on the 1D interval.
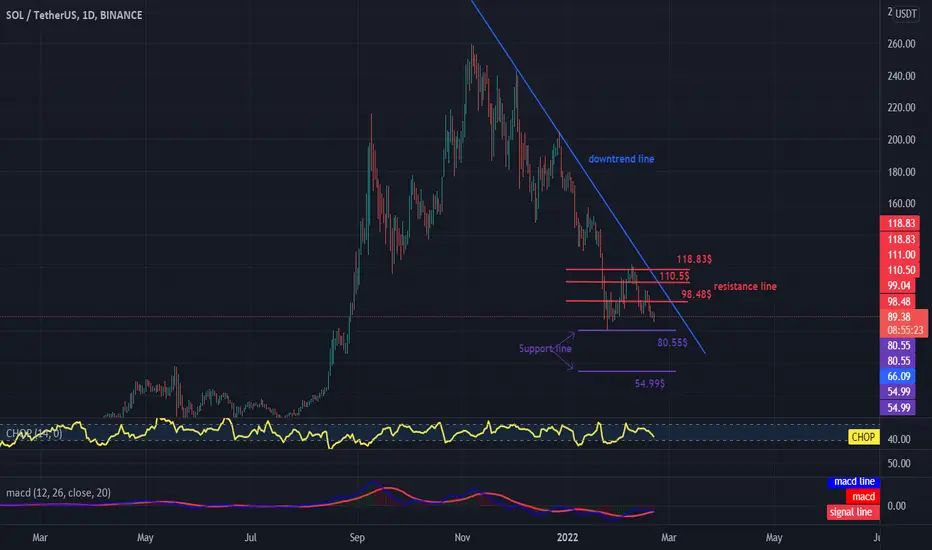
Let's start by determining the downtrend line under which the price moves.
Let's move on to the designation of support for the coming days, you can see that the first support is at the price of $ 80.55 and the next ones around $ 54.99.
Looking the other way, it is worth determining the closest resistances that SOL will have to overcome with price increases. We have the first resistance at $ 98.48 and another resistance at $ 110.5, $ 118.83.
It is worth looking at the CHOP indicator which shows that in the 1D interval there is a shortage of energy for the next move, and on the MACD indicator we see the blue line over the red one, thanks to which we can count on keeping the price
Let's take a look at the SOL / USDT chart on the 1D interval.
Let's start by determining the downtrend line under which the price moves.
Let's move on to the designation of support for the coming days, you can see that the first support is at the price of $ 80.55 and the next ones around $ 54.99.
Looking the other way, it is worth determining the closest resistances that SOL will have to overcome with price increases. We have the first resistance at $ 98.48 and another resistance at $ 110.5, $ 118.83.
It is worth looking at the CHOP indicator which shows that in the 1D interval there is a shortage of energy for the next move, and on the MACD indicator we see the blue line over the red one, thanks to which we can count on keeping the price
Disclaimer
The information and publications are not meant to be, and do not constitute, financial, investment, trading, or other types of advice or recommendations supplied or endorsed by TradingView. Read more in the Terms of Use.
Disclaimer
The information and publications are not meant to be, and do not constitute, financial, investment, trading, or other types of advice or recommendations supplied or endorsed by TradingView. Read more in the Terms of Use.