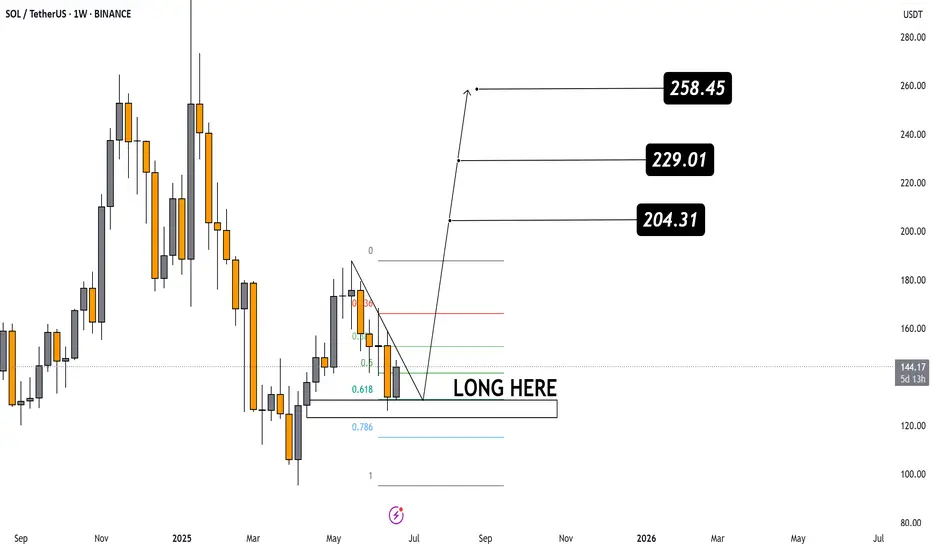
The chart shows a Falling Wedge pattern – a typically bullish reversal formation.
A breakout to the upside from the wedge has occurred, signaling the potential start of an upward trend.
📉 Entry Zone (LONG HERE):
Clearly marked around the Fibonacci support levels:
0.618 (~130 USDT)
0.786 (~115 USDT)
This support zone is strong and ideal for long positions.
📊 Fibonacci Retracement Levels:
0.382 – First resistance
0.5 – Mid-level resistance
0.618 – Strong retracement support that price bounced from
🎯 Target Projections:
204.31 USDT – First target; a strong historical resistance.
229.01 USDT – Second target; a breakout above this would confirm bullish strength.
258.45 USDT – Final target if the bullish momentum continues.
Subscribe to my Telegram Channel 👉 :
t.me/addlist/y5mi70s3c0Y3MDQ0
Subscribe to my X 👉 : x.com/VIPROSETR
t.me/addlist/y5mi70s3c0Y3MDQ0
Subscribe to my X 👉 : x.com/VIPROSETR
Disclaimer
The information and publications are not meant to be, and do not constitute, financial, investment, trading, or other types of advice or recommendations supplied or endorsed by TradingView. Read more in the Terms of Use.