Key Levels Identified
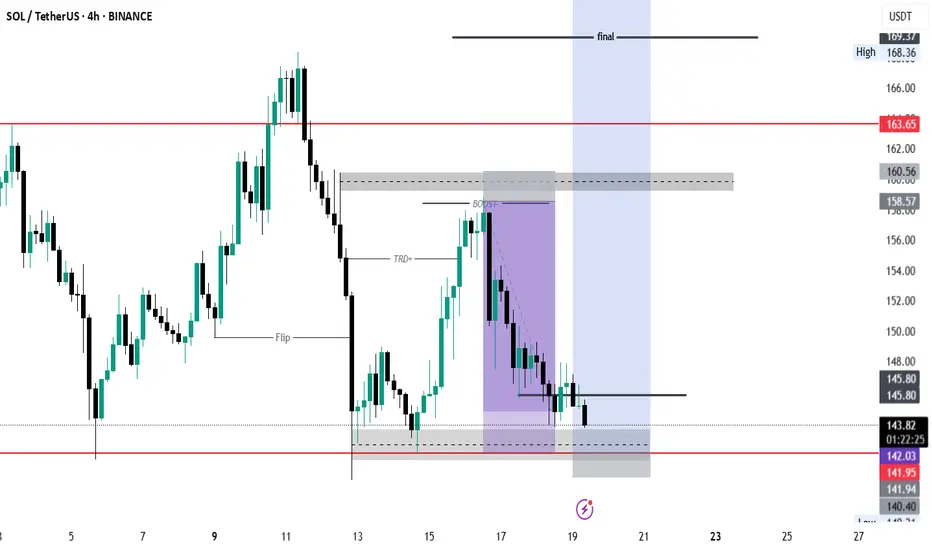
The chart shows several important institutional levels:
Supply Zone (Bearish Order Block): The upper gray/purple rectangle around 158-160 USDT represents a strong supply zone where institutional selling likely occurred, evidenced by the significant bearish move that followed.
Demand Zone (Bullish Order Block): The blue rectangle at the bottom around 142-145 USDT appears to be a demand zone where buying interest emerged, showing potential institutional accumulation.
Flip Level: The horizontal line around 150 USDT marked as "Flip" represents a key level that could act as support or resistance depending on market structure.
Disclaimer
The information and publications are not meant to be, and do not constitute, financial, investment, trading, or other types of advice or recommendations supplied or endorsed by TradingView. Read more in the Terms of Use.
Disclaimer
The information and publications are not meant to be, and do not constitute, financial, investment, trading, or other types of advice or recommendations supplied or endorsed by TradingView. Read more in the Terms of Use.