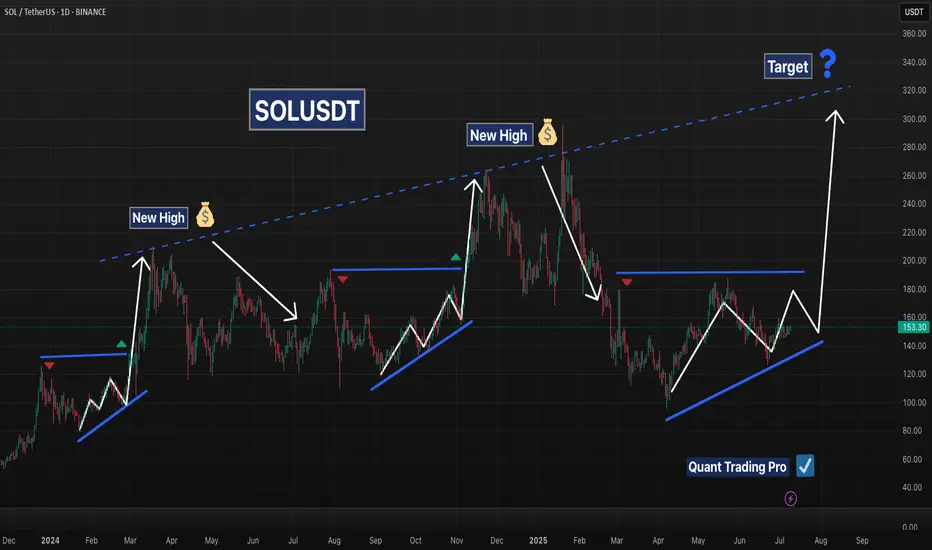
Solana’s chart reveals a recurring bullish pattern that has played out multiple times over the past year. In each instance, SOL formed a rising base or ascending triangle followed by a strong breakout and a new high. These breakouts typically occurred after:
A series of higher lows forming an ascending structure
Compression beneath horizontal resistance
A clean breakout followed by a rapid price expansion
The current price action appears to be forming the same structure once again:
A clear ascending support trendline is intact
Price is approaching the horizontal resistance zone near $180
The 50 EMA is turning upward and price is pressing above the 200 EMA
If SOL breaks above the $180 level with volume, it could mirror previous rallies and target the long-term diagonal resistance trendline, currently pointing toward the $300–$340 range. Until then, a pullback to retest support near $140–$150 would remain within the bullish structure.
Key Technical Features:
Consistent ascending accumulation patterns
Breakout levels followed by new highs
Current setup showing a third rising base near major resistance
Clear long-term diagonal trendline acting as a historical ceiling
This is a textbook example of price memory and structural repetition. Traders should monitor for a confirmed breakout above horizontal resistance with strong volume before positioning for continuation.
Try our strategy optimizer at quanttradingpro.com
Developing free strategies weekly stay tuned...
Join our discord discord.gg/2systG9frc
We provide education & tools.
Developing free strategies weekly stay tuned...
Join our discord discord.gg/2systG9frc
We provide education & tools.
Disclaimer
The information and publications are not meant to be, and do not constitute, financial, investment, trading, or other types of advice or recommendations supplied or endorsed by TradingView. Read more in the Terms of Use.