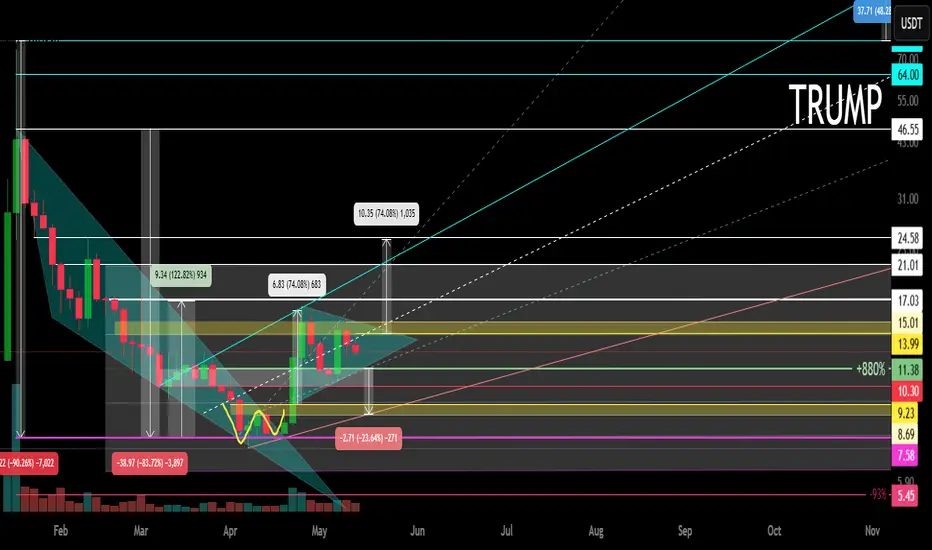
Logarithm. Time frame 3 days. After a super pump and a drive of "stupid money", a descending channel was formed on a natural dump. The price came out of it. Now a triangle is forming. The price is clamped. The reversal zones and percentages to the key support/resistance levels are shown extremely accurately according to TA.

If there is no aggressive exit in the medium term, then there will be consolidation and, as a consequence, the formation of a horizontal channel "sholtai / chattai", its key zones are shown.
Now, this "cryptocurrency" is now on 16 05 2025 in 41st place by capitalization.
Reductions from the price highs are about -90%.
From the liquid zone about -84%.
These are not the minimum values of the decline of such hype cryptocurrencies. Just take this into account in your money management. For clarity, the level zones and the % of potential decline if the trend breaks again are shown on the chart (pull the chart down).
Even with such a decline, the price is now at a huge profit. I am not speaking for the creators of the cryptocurrency, but for the first speculators and "investors" who may not have sold everything on the hype.
For the creators of the cryptocurrency, perhaps these are manipulators close to the Trump family, for them, any sale is super profit. But in order to sell, you need to maintain liquidity, and from time to time make interest in speculation and asset retention by investors, that is, do pumps and hype. Use this, and do not be greedy...

Levels and zones, pump/dump, which the price will "feel" are shown in advance. Click "play" on the chart and move the chart up. With a high degree of probability, the hype and pumping of the price of this cryptocurrency will be repeated, given the hype and the long term of the political figure whose name this cryptocurrency bears. Now it is a Trump dump, in the future it will become a Trump pump for some time.
Do not forget to sell on the next hype. If you understand that you are very greedy, and the news background affects you, then sell in parts, or use stop losses to protect profits.
There is no need to guess the minimums and maximums. It is important to know these zones, and have an acceptable average price, from the position of the trend, and its potential. It is regulated by the distributed entry volume (in advance) at potential reversal zones.
If there is no aggressive exit in the medium term, then there will be consolidation and, as a consequence, the formation of a horizontal channel "sholtai / chattai", its key zones are shown.
Now, this "cryptocurrency" is now on 16 05 2025 in 41st place by capitalization.
Reductions from the price highs are about -90%.
From the liquid zone about -84%.
These are not the minimum values of the decline of such hype cryptocurrencies. Just take this into account in your money management. For clarity, the level zones and the % of potential decline if the trend breaks again are shown on the chart (pull the chart down).
Even with such a decline, the price is now at a huge profit. I am not speaking for the creators of the cryptocurrency, but for the first speculators and "investors" who may not have sold everything on the hype.
For the creators of the cryptocurrency, perhaps these are manipulators close to the Trump family, for them, any sale is super profit. But in order to sell, you need to maintain liquidity, and from time to time make interest in speculation and asset retention by investors, that is, do pumps and hype. Use this, and do not be greedy...
Levels and zones, pump/dump, which the price will "feel" are shown in advance. Click "play" on the chart and move the chart up. With a high degree of probability, the hype and pumping of the price of this cryptocurrency will be repeated, given the hype and the long term of the political figure whose name this cryptocurrency bears. Now it is a Trump dump, in the future it will become a Trump pump for some time.
Do not forget to sell on the next hype. If you understand that you are very greedy, and the news background affects you, then sell in parts, or use stop losses to protect profits.
There is no need to guess the minimums and maximums. It is important to know these zones, and have an acceptable average price, from the position of the trend, and its potential. It is regulated by the distributed entry volume (in advance) at potential reversal zones.
Note
23 05 2025 Note
24 05 2025 I will note that after yesterday's transaction for 273 BTC, "news" with black humor came out today:
"Over the past 24 hours, 113,026 traders were liquidated, the total amount of liquidations was $ 273.73 million.
The largest single order for liquidation occurred on Bybit - BTCUSDT for $ 2.03M".
As we see, the code 273 is repeated, as well as other attention numbers, with 113, the number 26 (I wrote earlier in a post on bts and in the chat, - the trigger next date). 2.03, this is 666 (now, they shaved it, on a "flat place", on a micro movement).
If you don't understand all this humor "in secret to the whole world", ignore it... The usual logic of TA and compliance with money management in trading is more than enough for profitable trading. Don't complicate things by not understanding, or not wanting to understand, how the picture of the world can be shaken (this does not apply to trading and speculation).
Note
02 06 2025 For most altcoins, the third part of the "inverted head and shoulders" pattern is now forming (rollback, liquidity collection, longs removal), or its reformatting (not resistance breakthrough) into horizontal channels (weaker crypto wrappers). I also explained this logic earlier.
If you trade locally, then use limit trigger orders at the same time and for a breakout, do not forget to lower them if there is a decline. But, do not go to the limit orders if you have designated your entry points in advance according to your money and risk management. Do not abuse the margin in the longs removal zones!!!
Trade active
18 07 2025 ✅ Telegram. Finance + Trading: t.me/SpartaBTC_1318
✅ Telegram. Сrypto trading only: t.me/SpartaBTC_tradingview
✅ Instagram: instagram.com/spartabtc_1318
✅ YouTube (Rus): goo.su/vpRzRa2
✅ Telegram. Сrypto trading only: t.me/SpartaBTC_tradingview
✅ Instagram: instagram.com/spartabtc_1318
✅ YouTube (Rus): goo.su/vpRzRa2
Disclaimer
The information and publications are not meant to be, and do not constitute, financial, investment, trading, or other types of advice or recommendations supplied or endorsed by TradingView. Read more in the Terms of Use.
✅ Telegram. Finance + Trading: t.me/SpartaBTC_1318
✅ Telegram. Сrypto trading only: t.me/SpartaBTC_tradingview
✅ Instagram: instagram.com/spartabtc_1318
✅ YouTube (Rus): goo.su/vpRzRa2
✅ Telegram. Сrypto trading only: t.me/SpartaBTC_tradingview
✅ Instagram: instagram.com/spartabtc_1318
✅ YouTube (Rus): goo.su/vpRzRa2
Disclaimer
The information and publications are not meant to be, and do not constitute, financial, investment, trading, or other types of advice or recommendations supplied or endorsed by TradingView. Read more in the Terms of Use.