Yesterday’s analysis: Support Cluster from Ichimoku Cloud, Bollinger Band, and trendline. Visible range > monthly 9. Just noticed that a monthly 9 preceded the last bubble.
Patterns: Pitchfork
Horizontal support and resistance: S: $67.10 R: $69.28
12 & 26 EMA’s (calculate % difference): 12: -4.41% 26: -3.21%
MA crossovers: Bearish cross on 1h preceded sell off. Recent bullish cross on the weekly.
FIB’s: 0.381 at $77.28 | 0.236 at $60.72 | 0.5 at $90.67
Candlestick analysis: Waiting for consolidation
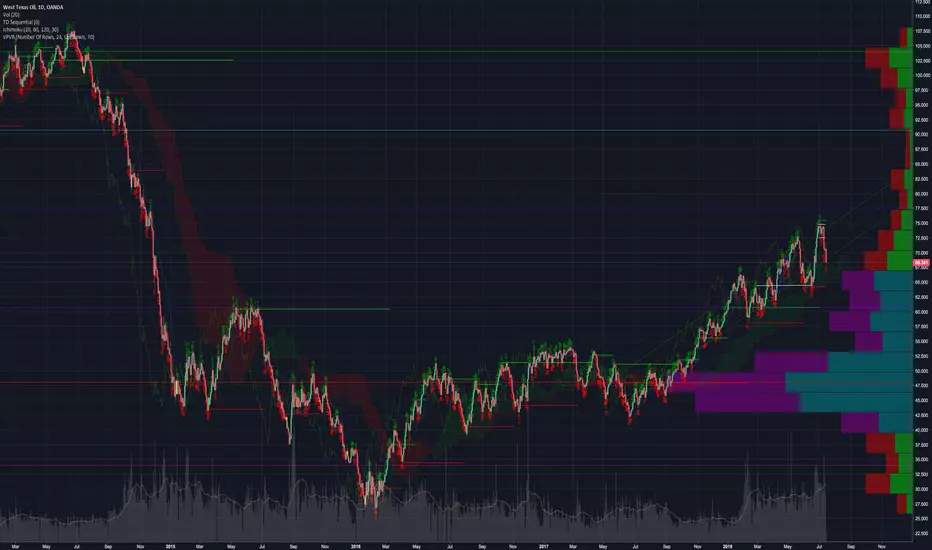
Ichimoku Cloud: D: fully bullish, expecting cloud to act as support at $68 W: Tenkan at $67.68 and starting to develop a c clamp
TD' Sequential: 3d has called the last two tops. Shows major support at $66.13 and resistance at $72.37. Red 8 on the daily tells me to get fully positioned before tomorrow’s close. Currently bouncing off red 9 on the 1 hour. If we break back above $69.50 then it will be time to seriously consider entering.
Visible Range: Good support at this level with very little built up resistance until $90.
50 & 200 MA’s (calculate % difference): 50: -1.65% 200: +8.22% 50 just started to angle downward. 50 period MA on 3d chart has been a final line of support for the bulls.
Bollinger Bands: 1W: MA at $67.55. Bottom band lines up with 50 week MA very nicely. 3D: just cross MA to the downside. 1D: Wider than we have seen it in years. Bottom band is angling sharply upward.
Trendline: Bottom end up bull trend at $66.23
Daily Trend: Bearish since 7/5
Fractals: DOWN = $63.6 UP = $74.75
Volume: Lowest volume we have seen since 11/23/2017
“As for me, I have no desire to carry the football from end zone to end zone. Just give me the territory between the 20 yard lines.” peterbrandt
Yard line of trend:
Start: $42
Target: $90
Field Lenge: $52
Current Price: $68.35
Yardline: 50
Conclusion: Volume has sharply decreased since 7/12 as price has pulled back. This indicates a dwindling amount of supply at these price levels. Visible range volume profile shows very little resistance between current price levels and $90. Recent bullish cross on weekly is a very good confirmation that this trend has room to go.
There will be a support cluster from $67 - $69 due to: trendline, kumo support from daily Ichimoku Cloud, Visible Range Volume Profile, prior horizontal resistance turning into support. Bottom band of the daily BB, and the MA from the weekly BB.
Red 8 on the daily TD' Sequential tells me to get fully positioned before tomorrow's close. Order currently set at $67.51. If price does not get there then I will be buying the next consolidation.
Patterns: Pitchfork
Horizontal support and resistance: S: $67.10 R: $69.28
12 & 26 EMA’s (calculate % difference): 12: -4.41% 26: -3.21%
MA crossovers: Bearish cross on 1h preceded sell off. Recent bullish cross on the weekly.
FIB’s: 0.381 at $77.28 | 0.236 at $60.72 | 0.5 at $90.67
Candlestick analysis: Waiting for consolidation
Ichimoku Cloud: D: fully bullish, expecting cloud to act as support at $68 W: Tenkan at $67.68 and starting to develop a c clamp
TD' Sequential: 3d has called the last two tops. Shows major support at $66.13 and resistance at $72.37. Red 8 on the daily tells me to get fully positioned before tomorrow’s close. Currently bouncing off red 9 on the 1 hour. If we break back above $69.50 then it will be time to seriously consider entering.
Visible Range: Good support at this level with very little built up resistance until $90.
50 & 200 MA’s (calculate % difference): 50: -1.65% 200: +8.22% 50 just started to angle downward. 50 period MA on 3d chart has been a final line of support for the bulls.
Bollinger Bands: 1W: MA at $67.55. Bottom band lines up with 50 week MA very nicely. 3D: just cross MA to the downside. 1D: Wider than we have seen it in years. Bottom band is angling sharply upward.
Trendline: Bottom end up bull trend at $66.23
Daily Trend: Bearish since 7/5
Fractals: DOWN = $63.6 UP = $74.75
Volume: Lowest volume we have seen since 11/23/2017
“As for me, I have no desire to carry the football from end zone to end zone. Just give me the territory between the 20 yard lines.” peterbrandt
Yard line of trend:
Start: $42
Target: $90
Field Lenge: $52
Current Price: $68.35
Yardline: 50
Conclusion: Volume has sharply decreased since 7/12 as price has pulled back. This indicates a dwindling amount of supply at these price levels. Visible range volume profile shows very little resistance between current price levels and $90. Recent bullish cross on weekly is a very good confirmation that this trend has room to go.
There will be a support cluster from $67 - $69 due to: trendline, kumo support from daily Ichimoku Cloud, Visible Range Volume Profile, prior horizontal resistance turning into support. Bottom band of the daily BB, and the MA from the weekly BB.
Red 8 on the daily TD' Sequential tells me to get fully positioned before tomorrow's close. Order currently set at $67.51. If price does not get there then I will be buying the next consolidation.
Note
Yesterday’s analysis: Confluence of support, declining volume and 9 on the daily TD’ SequentialPatterns: Pitchfork
Horizontal support and resistance: S: $67.25 R: $68.62
9 & 21 EMA’s (calculate % difference): 9& 21: -3.52% currently making bearish cross
MA crossovers: Bullish. 50 just started to angle downward
FIB’s: 0.236 at $60.72 | 0.382 at $77.28 | 0.5 at $90.67
Candlestick analysis: Daily doji at support cluster
Ichimoku Cloud: Top of daily cloud acting as support. Tenkan is started to separate from the Kijun
TD Sequential: Red 9 on the daily is completing the buy setup. Red 7 on the countdown. Red 1 on the weekly. Green 2 on the monthly.
Visible Range: Clear skies until $90
50 & 200 MA’s (calculate % difference): 50: -2.18% 200: +7.64%
Bollinger Bands: Very wide on the daily. Bottom band part of support cluster. MA on weekly is apart of the support cluster.
Trendline: At trend support
Daily Trend: Bearish since 7/5
Fractals: DOWN: $63.63 UP: $74.73
On Balance Volume: Bull div on daily. Has not pulled back like the price would suggest.
Conclusion: Same as yesterday. 1st order got filled at $67.50. Still have 60% waiting to enter. Want to see reversal candles at support cluster and/or a green 2 above a green 1 on the daily.
emasar Indicator is available for purchase at alphanalysis.io/product/emasar/
Disclaimer
The information and publications are not meant to be, and do not constitute, financial, investment, trading, or other types of advice or recommendations supplied or endorsed by TradingView. Read more in the Terms of Use.