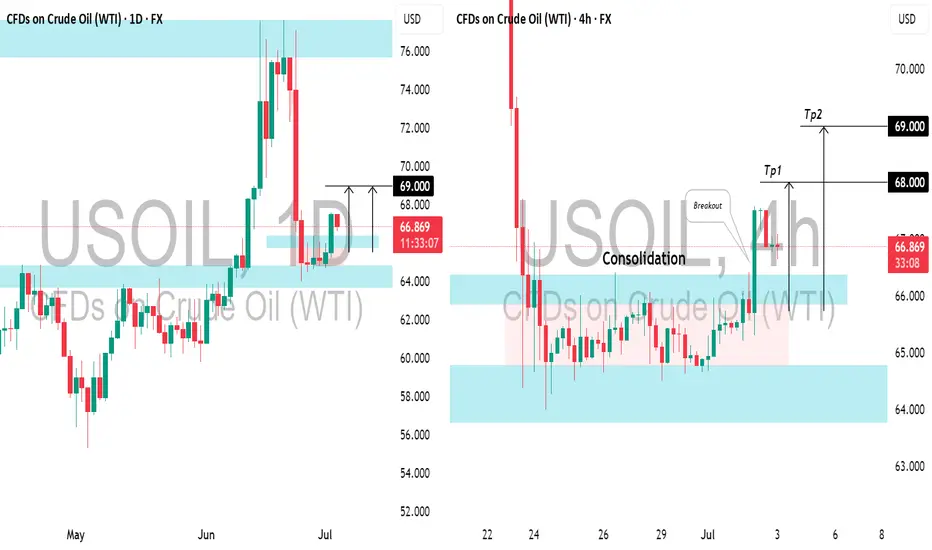
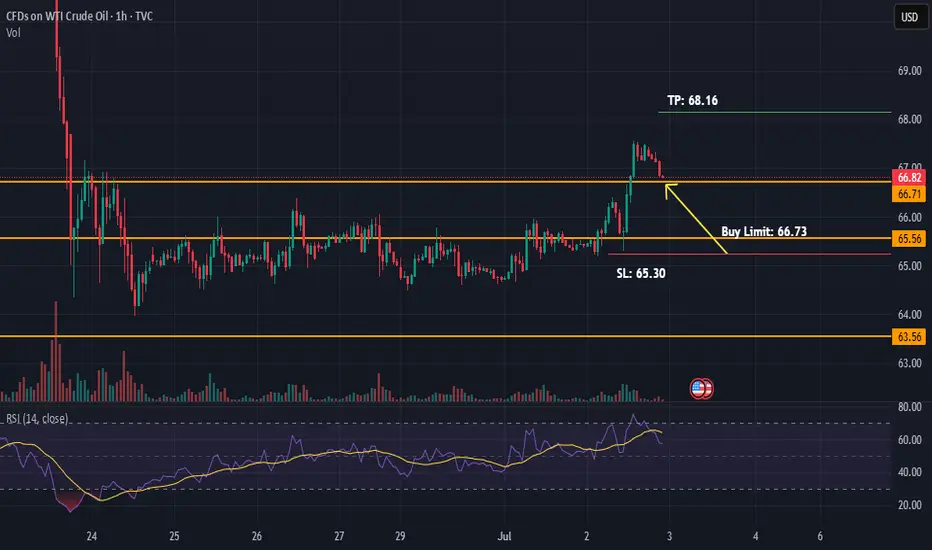
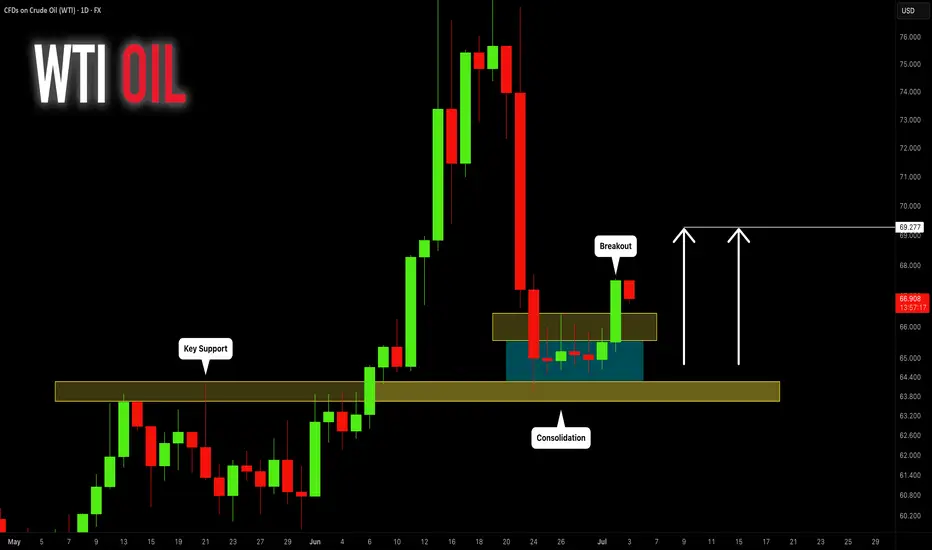
US CRUDE OIL (WTI): Bullish Move From Support📈USOIL appears to be bullish following a consolidation at a significant daily support level.
The emergence of a bullish imbalance candle reinforces this positive outlook.
I anticipate the price will rise to at least 68.00, potentially reaching 69.00.
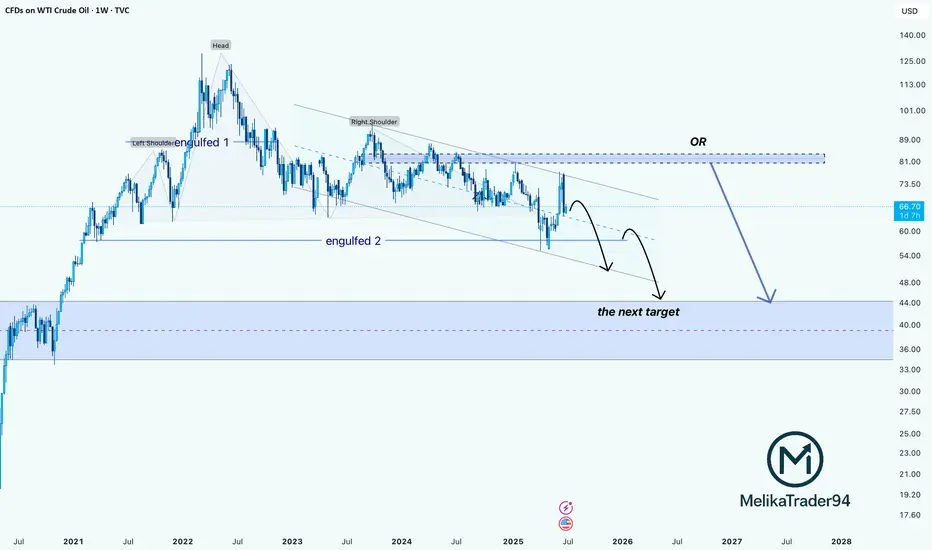
WTI Crude Oil: Double Engulf + H&S Breakdown Points to $40Hello guys! Let's dive into WTI!
The weekly chart of WTI Crude Oil reveals a bearish Head & Shoulders pattern playing out over a long-term descending channel. Price recently got rejected from the upper trendline, showing weakness despite a short-term bounce.
- Engulfed 1 & 2:
Two major engulfin
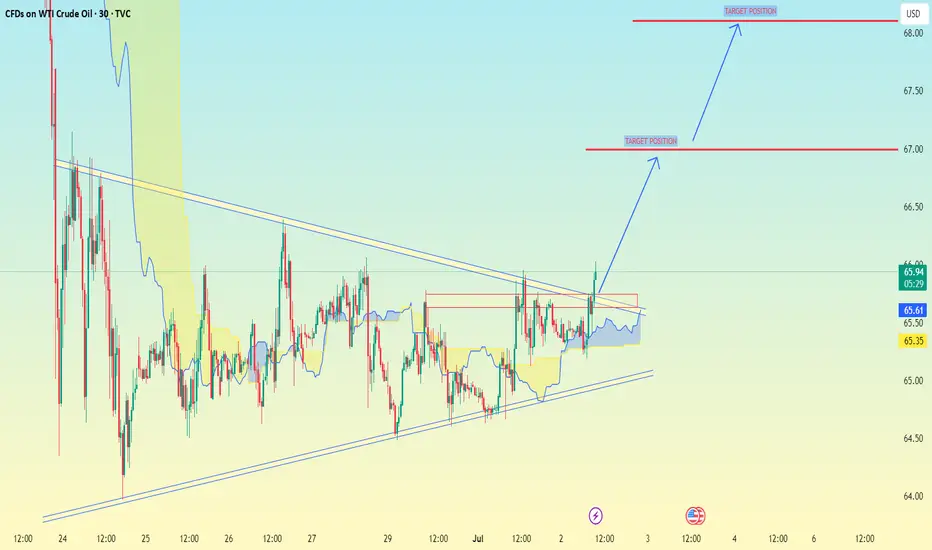
(WTI Crude Oil) on the 30-minute timeframe:(WTI Crude Oil) on the 30-minute timeframe:
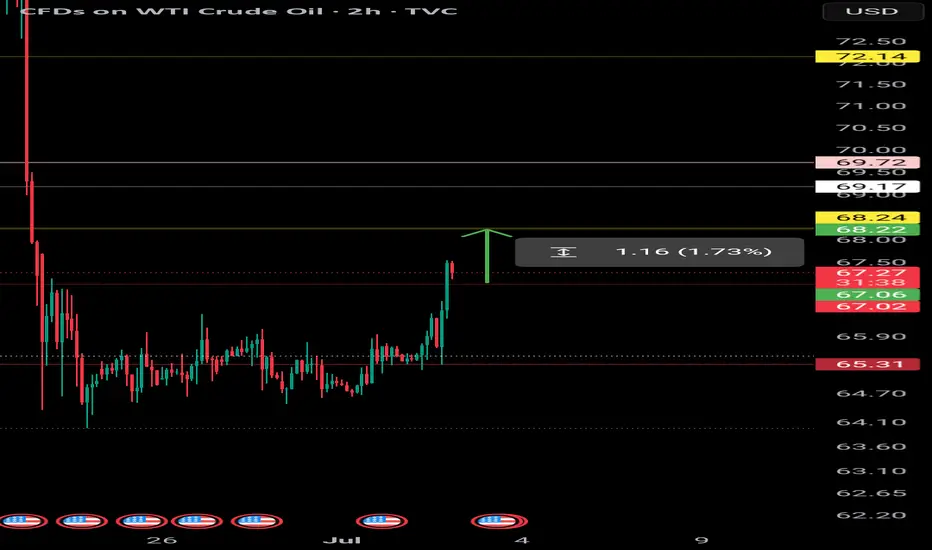
You have a clear triangle breakout happening.
The chart shows two bullish target positions marked with blue arrows.
Based on your chart:
Current Price Zone: Around 66.20 - 66.25
Target Levels:
✅ First Target: 67.00
✅ Second Target: 68.00 - 68.10
-
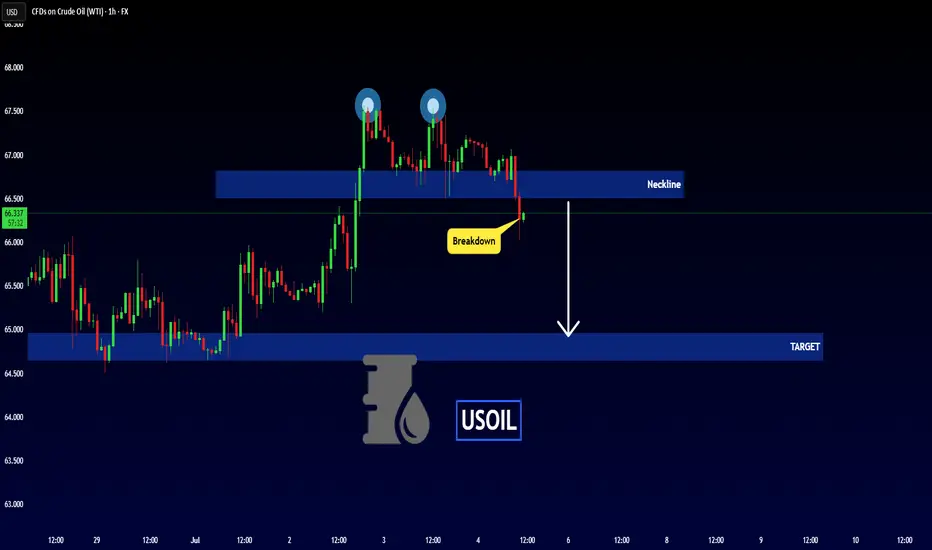
USOIL - Bearish Double TOPHello Traders !
The USOIL failed to create a new higher high!
The price formed a double top pattern.
Currently, The neckline is broken !
So, I expect a bearish move📉
________________
TARGET: 64.960🎯
OIL Price ForecastOIL Price Forecast
In this video, I break down the potential price developments for oil in the weeks ahead.
So far, the price action appears contracted, suggesting a period of consolidation.
However, after this pause, a further decline remains the most likely scenario.
You may watch the analy

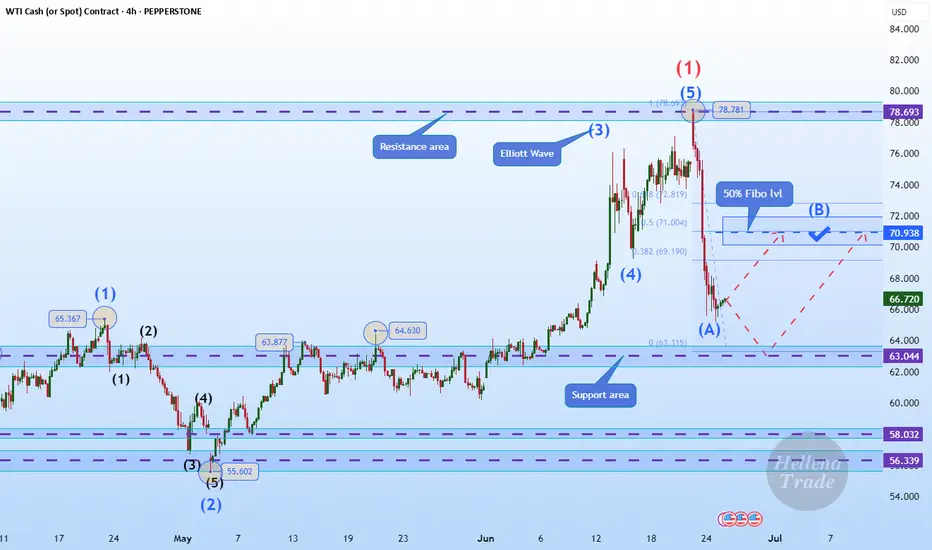
Hellena | Oil (4H): LONG to 50% lvl Fibo area of 70.00.Colleagues, after a long break, I think it is worth returning to oil forecasts. The situation is stabilizing a bit and now I think that the price is in a strong correction (ABC) at the moment I see wave “B”, which may reach the area of 50% Fibonacci 70 level.
It is possible that wave “A” will conti
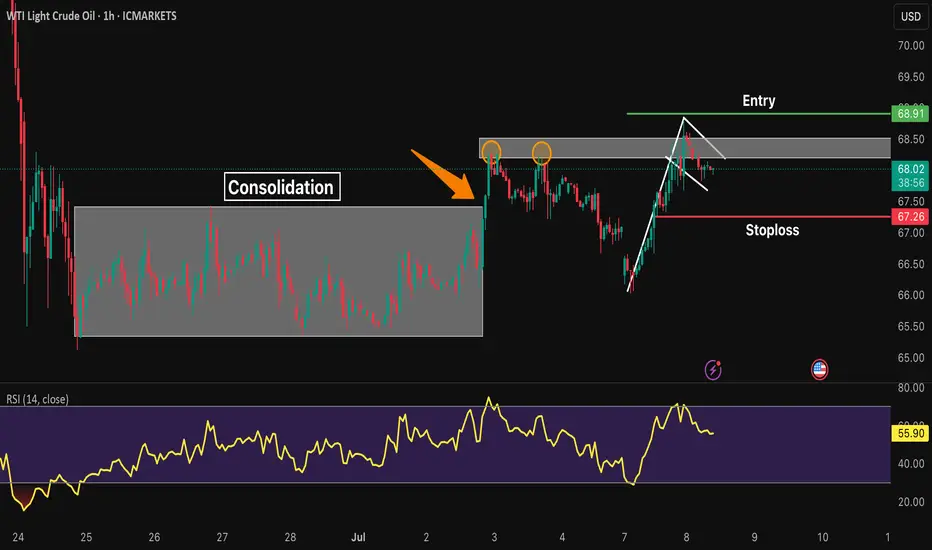
XTIUSD* Bullish Trend after consolidation box break.
* Bullish flag pattern is formed.
* Entry will be taken at the break of the pole.
* Stoploss is below the last HL.
WTI : Could rise to this resistance by the end of today.It is standing between its own important support and resistance, which is expected to advance given the news surrounding the Strait of Hormuz.
CRUDE OIL (WTI): Consolidation is Over
Crude Oil was consolidating for 6 trading days in a row
after a test of a key daily support.
The yesterday's Crude Oil Inventories data made the market bullish
and the price successfully violated a minor resistance of a sideways movement.
We can expect that the market will grow more.
Next resis
See all ideas
Displays a symbol's price movements over previous years to identify recurring trends.