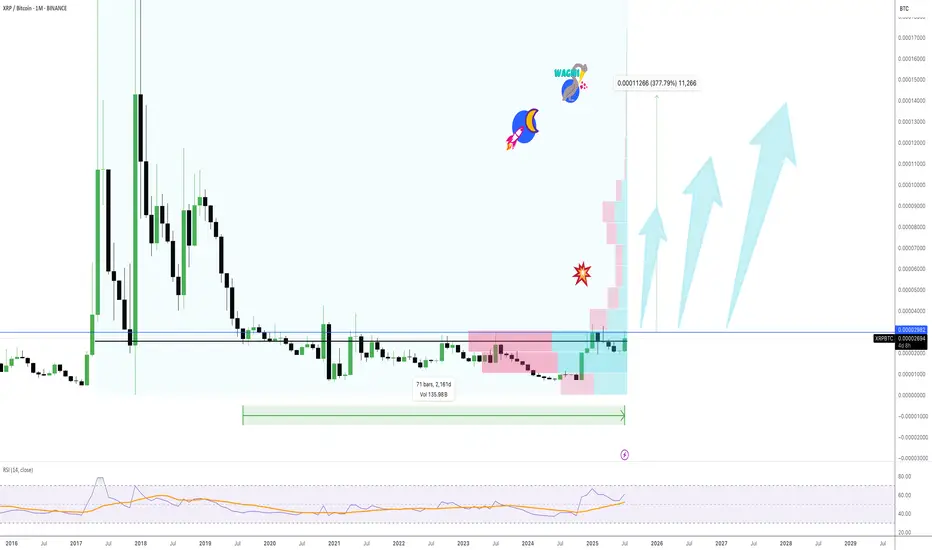
6 years ago (in august) we dropped under the resistance zone marked in blue on the chart and couldn’t brake it.
6 years later we are coming close to this trend line with a new attempt. Maybe a coincidence that now in August we can brake it?
After being in a range for so long the bullish breakout on this could be wild.
And as we see on the chart, behind this resistance there is not much resistance left!
I personally expect a break for about 200 or 300% to the upside.
Everything is lining up perfectly, the SEC case, all the ETF’s waiting,…
This week will be huge for XRP and believe in august we brake through.
Have a nice Sunday.
Note
One more note: the bitcoin dominance is about to fall off a cliff, that's bullish for ALTcoins CHECK IT OUT 😎
⬇️⬇️⬇️
youtube.com/channel/UC_UP6XvTaTEKIapdM-aKzWA
twitter.com/TheChartingArt
⬇️⬇️⬇️
youtube.com/channel/UC_UP6XvTaTEKIapdM-aKzWA
twitter.com/TheChartingArt
Disclaimer
The information and publications are not meant to be, and do not constitute, financial, investment, trading, or other types of advice or recommendations supplied or endorsed by TradingView. Read more in the Terms of Use.
Disclaimer
The information and publications are not meant to be, and do not constitute, financial, investment, trading, or other types of advice or recommendations supplied or endorsed by TradingView. Read more in the Terms of Use.