Hey! I am back with Another Technical Analysis with updates!
The More likes, the More updates!
This time looking again at XRP as the best performing cryptocurrency in the despair crypto market!
So why I am looking at XRP/BTC chart and not XRP/USDT?
Because the BTC chart shows actual Ripple moves, demand and way precise candles. In USD value you may see that Ripple is losing Value, when in real its just rising in value, that why we look at XRP/BTC in short.
My portfolio is almost 80% Xrp and I still havent sold any, as I am constantly looking at Xrp and still shaking my head, when looking at the strong demand which is Ripple showing us.
In my last TA on XRP I pointed out, that Ripple is acting really strong in such despair market, and thats still true!

Lets look at current situation.
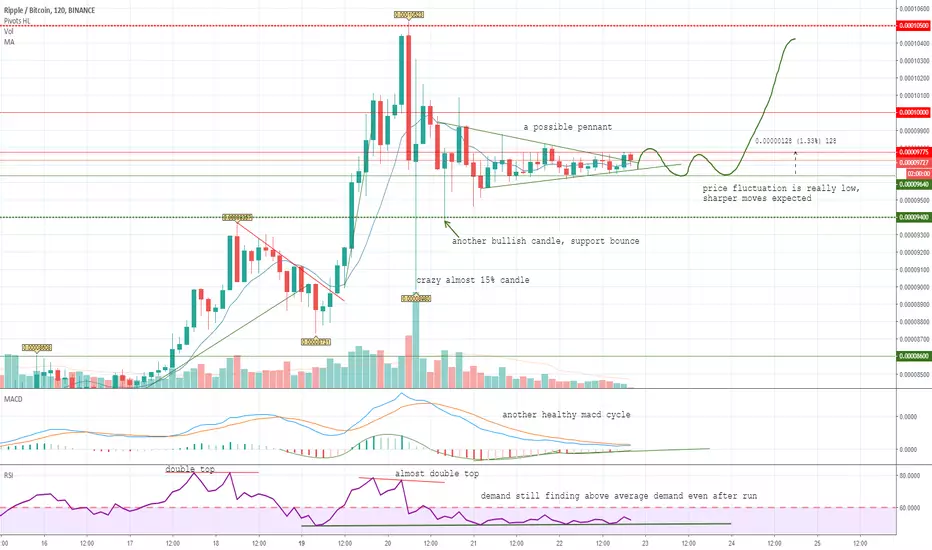
Ripple has performed sharp breakout bouncing off 8731(three good demand candles), breaking downtrend and testing 10,500 sats where XRP found ressistance, performed almost good looking double top and started retracing.
Many people thought XRP will dump hard after this ressistance was found, and in the panic in this despair market they sold their XRP.
So ripple actually dropped to 8,980, and immediately bounced off performing crazy long 15% candle, this is just another sign of XRP strong demand.
After that another ressistance was tested and another sharp test of 9,400 has occured, which result was a sharp bounce, crazy how XRP acts.
Strong volume was still in XRP and price has been fluctuating strongly, but has managed to stay relatively stable currently fluctuating between support of 9,640 and ressistance of 9,775.
And once again, XRP is in good known low volume period of consolidation waiting for another sharper move to come.
Its a good bullish sign that XRP can stay such stable even after such sharp moves and despair market.
Okay, so candles, Volume, trend and demand based on candles looks good, are Indicators looking good as well? Lets take a peek.
MACD - Shows another healthy bullish cycle, after one strong buying wave, two average selling waves occured. Lanes headed to neutral zone where Blue lane is very likely to overtake slow lane.
RSI - Seen some double tops, after second double top, a strong RSI support has been found and its somehow still uptrending, so bassicaly after a good runup, ussualy a lower demand is seen as profit taking but this time once again, its still above average, another bullish sign for XRP.
Conclusion.
Ripple will fluctuate with low volume in this tight price range for a short period of time, after that sharper move to retest 10,500 is very likely to occur.
Its hard to tell when as volume comes unpexctedly in low volume period, but after ressistance of 9,775 will get broken volume will come for sure!
Thats all from me, for now. If you agree with this Technical Analysis , consider leaving that "Agree Button" blue, as it leads me to post more similiar Technical Analysis .
Thanks for your time and good luck trading!
The More likes, the More updates!
This time looking again at XRP as the best performing cryptocurrency in the despair crypto market!
So why I am looking at XRP/BTC chart and not XRP/USDT?
Because the BTC chart shows actual Ripple moves, demand and way precise candles. In USD value you may see that Ripple is losing Value, when in real its just rising in value, that why we look at XRP/BTC in short.
My portfolio is almost 80% Xrp and I still havent sold any, as I am constantly looking at Xrp and still shaking my head, when looking at the strong demand which is Ripple showing us.
In my last TA on XRP I pointed out, that Ripple is acting really strong in such despair market, and thats still true!
Lets look at current situation.
Ripple has performed sharp breakout bouncing off 8731(three good demand candles), breaking downtrend and testing 10,500 sats where XRP found ressistance, performed almost good looking double top and started retracing.
Many people thought XRP will dump hard after this ressistance was found, and in the panic in this despair market they sold their XRP.
So ripple actually dropped to 8,980, and immediately bounced off performing crazy long 15% candle, this is just another sign of XRP strong demand.
After that another ressistance was tested and another sharp test of 9,400 has occured, which result was a sharp bounce, crazy how XRP acts.
Strong volume was still in XRP and price has been fluctuating strongly, but has managed to stay relatively stable currently fluctuating between support of 9,640 and ressistance of 9,775.
And once again, XRP is in good known low volume period of consolidation waiting for another sharper move to come.
Its a good bullish sign that XRP can stay such stable even after such sharp moves and despair market.
Okay, so candles, Volume, trend and demand based on candles looks good, are Indicators looking good as well? Lets take a peek.
MACD - Shows another healthy bullish cycle, after one strong buying wave, two average selling waves occured. Lanes headed to neutral zone where Blue lane is very likely to overtake slow lane.
RSI - Seen some double tops, after second double top, a strong RSI support has been found and its somehow still uptrending, so bassicaly after a good runup, ussualy a lower demand is seen as profit taking but this time once again, its still above average, another bullish sign for XRP.
Conclusion.
Ripple will fluctuate with low volume in this tight price range for a short period of time, after that sharper move to retest 10,500 is very likely to occur.
Its hard to tell when as volume comes unpexctedly in low volume period, but after ressistance of 9,775 will get broken volume will come for sure!
Thats all from me, for now. If you agree with this Technical Analysis , consider leaving that "Agree Button" blue, as it leads me to post more similiar Technical Analysis .
Thanks for your time and good luck trading!
Note
Note
Note
Note
Note
RSI last time found bullish level 60 ressistance, this time 60 was broken and RSI was broken free. Way high above ema, even if xrp fall to 8200, it would be still considered as somehow bullish. More about weekly at another TA, stay tuned.
Note
Will hit you up with some more updates at morning, until then, goodnight.
Note
Ripple went for another test of ressistance level, was testing for a while, unsuccesfuly then went for another sharp retest of 9,775 and failed, struggling to break 60rsi level, as bullish breaking level. Two red candles appeared that had potential to break the setup and perform downtrend but luckily demand was strong once again, full closed candles above 9400 and bullish wick can be seen. Short downtrend, but sharp one, was broken by an uptrend and Ripple found its previous support level 9,640 as current ressistance with current support of 9,525.
MACD has started a buying wave and RSI found support twice at same level above 40, finding support twice at this "low" level can mean the opposite as double rsi top.
Note
Note
Note
Note
Note
Note
Note
Seems like Ripple has broken 9,400 support. Currently in gym, when I will be in front of laptop, will post an update. Stay tuned.Note
Oh, and also thanks for all the support, do you like this "updates" Concept? I may do it more frequently if I see enough demand for it, hah. Thanks again!Note
Note
Note
Note
Note
Ripple has performed bullish macd slide and its still uptrending in buying wave. RSi is still showing good increasing demand when being on the border of oversold. As I pointed out yesterday, 9300 is a really strong level and Ripple has confirmed my words, broken 9400 easily but found ressistance at 9500, this is still a good sign that ripple can grow and maintain its price even on higher time frame selling wave. Another downtrend after 9500 was formed and 9300 was retested again, this downtrend was recently broken and ripple found some ressistance at 9400, where is struggling currently.
Disclaimer
The information and publications are not meant to be, and do not constitute, financial, investment, trading, or other types of advice or recommendations supplied or endorsed by TradingView. Read more in the Terms of Use.
Disclaimer
The information and publications are not meant to be, and do not constitute, financial, investment, trading, or other types of advice or recommendations supplied or endorsed by TradingView. Read more in the Terms of Use.