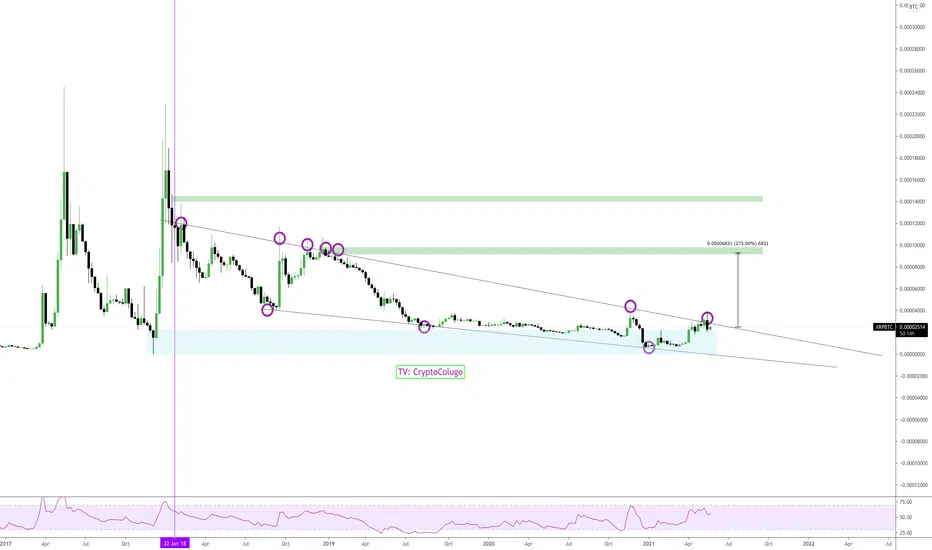
This is the weekly chart for XRPBTC.
To me it seems that we are in a very big falling wedge pattern. The upper trend line started acting as resistance since 22/01/2018, we have about 7 resistance touches and 3 as support which makes it a valid pattern to me. It will be notable once we can finally see a candle close above the resistance line.
What else we can see is that we are currently in a major demand zone ( blue box)
On the XRPBTC chart we still have a lot of room to move higher , that’s also the case for XLM and LTC.
For every new follower I will add a new idea :)
CHECK IT OUT 😎
⬇️⬇️⬇️
youtube.com/channel/UC_UP6XvTaTEKIapdM-aKzWA
twitter.com/TheChartingArt
⬇️⬇️⬇️
youtube.com/channel/UC_UP6XvTaTEKIapdM-aKzWA
twitter.com/TheChartingArt
Disclaimer
The information and publications are not meant to be, and do not constitute, financial, investment, trading, or other types of advice or recommendations supplied or endorsed by TradingView. Read more in the Terms of Use.
Disclaimer
The information and publications are not meant to be, and do not constitute, financial, investment, trading, or other types of advice or recommendations supplied or endorsed by TradingView. Read more in the Terms of Use.