Convergence & DivergenceOne of the important concepts that traders should understand is the difference between divergence and convergence, two terms that are often used interchangeably but have distinct meanings and implications for trading.
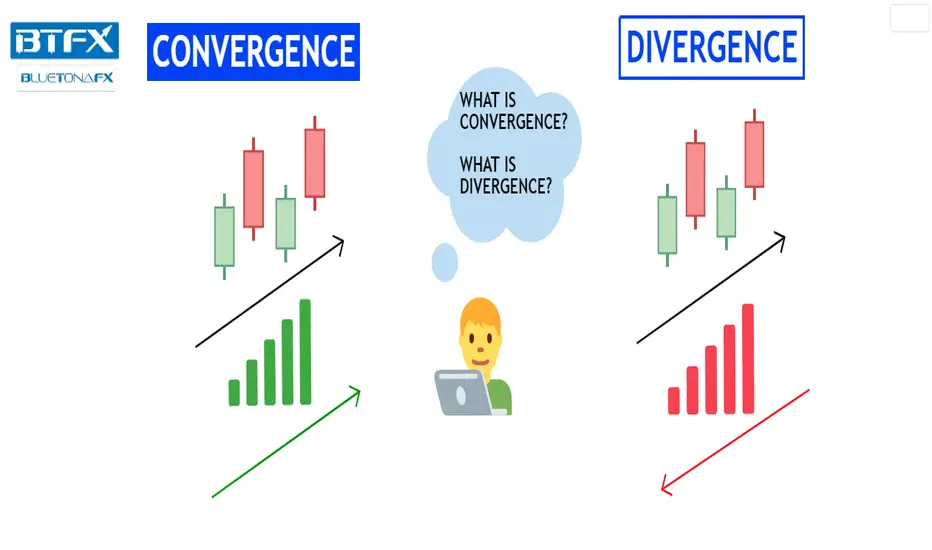
Convergence refers to a situation where both the price of an asset and a technical indicator are moving in the same direction. For example, in a situation in which both the price of an asset and an indicator show an uptrend, there is a high probability that the trend will continue. So, here, the price and indicator CONVERGE (follow the same direction), and the trader may hesitate to trade in the opposite direction, as this is often seen as confirmation that the price movement is strong and likely to continue.
Divergence refers to a situation where the price of an asset is moving in one direction while a technical indicator is moving in the opposite direction. For example, if we again consider the situation when the price of an asset shows an uptrend and, this time, the trend of a technical indicator is falling, there is a high probability of a trend reversal. So, here, the price and indicator DIVERGE (go in opposite directions). This is often seen as a warning sign that the price movement may not be sustainable and could soon reverse.
To further understand the difference between convergence and divergence, let's look at some of the most commonly used technical indicators in trading:
Relative Strength Index (RSI)
RSI measures the strength of an asset by comparing the average gains and losses over a specified period of time. When the RSI value is above 70, it is considered overbought and is seen as likely to reverse soon. When the RSI value is below 30, it is considered oversold and is seen as likely to rebound.
RSI Convergence
RSI Divergence
Moving Average Convergence Divergence (MACD)
MACD measures the difference between two moving averages of an asset's price movements. Traders use the MACD to identify when bullish or bearish momentum is high. There is usually one short-term moving average and one long-term moving average. When the short-term moving average crosses above the long-term moving average, it is seen as a bullish signal, while a cross below the long-term moving average is seen as a bearish signal.
MACD Convergence
MACD Divergence
Commodity Channel Index (CCI)
CCI measures the difference between an asset's price change and its average price change. High positive readings indicate that the asset's price is above its average, which is seen as a bullish signal. Low negative readings indicate the asset's price is below its average, which is seen as a bearish signal. If the CCI value is above +100, this is seen as a signal of the start of an uptrend. If the CCI value is below -100, this is seen as a signal of the start of a downtrend.
CCI Convergence
CCI Divergence
It is crucial to note that convergence and divergence are not guaranteed indicators of future price movements. Traders should use them in conjunction with other technical and fundamental analyses to aid their trading decisions. Traders should also be cautious of the fact that all indicators are lagging behind the current price action, and therefore they must be prepared to adjust their strategies accordingly.
Trade safely and responsibly.
BluetonaFX
Divergence
The Divergence Cheat Sheet: Your Quick Reference GuideHello dear @TradingView community!
In this guide, we will delve into the concept of divergence and its significance in technical analysis, specifically focusing on its application in the cryptocurrency market, particularly Bitcoin.
Understanding Divergence: A Key Concept in Trading
Divergence occurs when the price of an asset and an indicator, such as the Relative Strength Index (RSI), move in opposite directions. This pattern provides valuable insights into potential price reversals or changes in trends.
The Divergence Cheat Sheet
To help us identify and interpret divergence patterns, a divergence cheat sheet can be an invaluable tool. It provides a concise overview of different divergence patterns and assists us in making timely and accurate decisions.
By having a cheat sheet on hand, you can save time, reduce errors, and ensure they don't miss crucial signals in the fast-paced cryptocurrency market.
Detecting Divergence
Detecting divergence is crucial for identifying lucrative trading opportunities. By using divergence indicators like the RSI, MACD, or Stochastic Oscillator, we can gain significant insights into market trends and potential price reversals.
To pinpoint divergence effectively, follow these steps:
Choose an indicator capable of detecting divergence, such as the RSI, MACD, or Stochastic Oscillator.
Look for discrepancies between the indicator and the price action. Regular divergence occurs when the price and the indicator move in opposite directions, while hidden divergence occurs when they move in the same direction but at different rates.
Monitor the direction of the trend. Divergence can indicate a trend reversal, so keeping track of the current market trend is crucial.
Confirm the divergence signal with other technical analysis tools. Divergence is just one piece of the puzzle, so it's essential to use other indicators to validate your trading decisions.
Examples of Divergence in Trading Charts
Let's examine a few examples of divergence on Bitcoin charts:
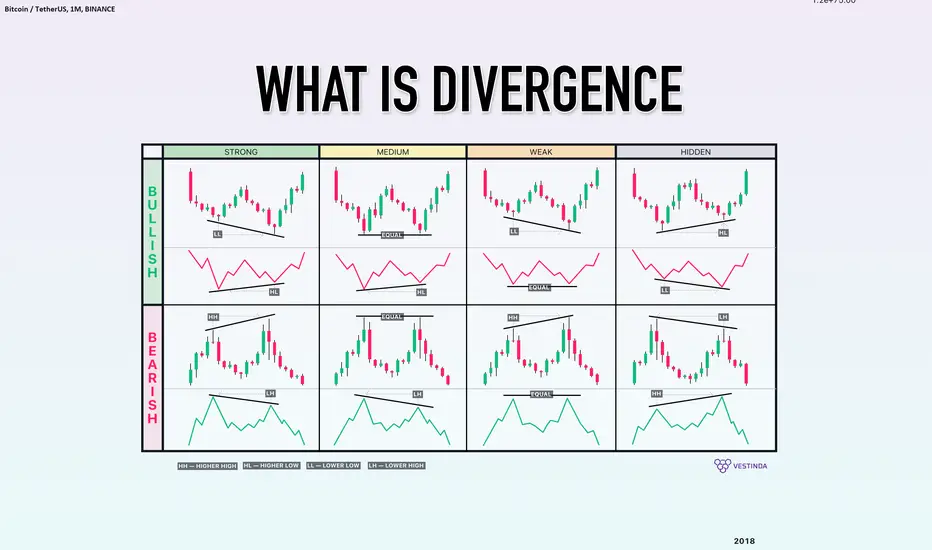
Strong Bullish Divergence:
When lows of the price decreases while the RSI increases, a regular bullish divergence occurs. This signals a potential trend reversal and presents an opportunity for a bullish trade.
Strong Bearish Divergence:
When highs the price of an asset is rising while the RSI is falling, it indicates a regular bearish divergence. This suggests a potential trend reversal and presents an opportunity for a bearish trade.
Medium Bullish Divergence:
When the lows of an asset remain equal while the RSI is rising, it indicates a medium bullish divergence. This suggests a potential increase in price, although it may not be a strong upward movement.
Medium Bearish Divergence:
When the highs of an asset remain unchanged while the RSI is decreasing, it indicates a medium bearish divergence. This suggests a potential decline in price, although the downward movement may not be significant.
Weak Bullish Divergence:
When the lows of an asset is decreasing while the RSI lows is equal, it indicates a weak bullish divergence. This suggests a potential increase in price, although it may not be a strong upward movement.
Weak Bearish Divergence:
When the highs of an asset are rising while the RSI remains unchanged, it indicates a moderate bearish divergence. This suggests a potential decline in price, although the downward movement may not be significant.
Hidden Bullish Divergence:
Hidden bullish divergence occurs when the price creates higher lows while the RSI is creating lower lows. This reinforces an existing uptrend and suggests its strength.
Hidden Bearish Divergence:
Hidden bearish divergence is observed when the price forms lower highs while the RSI forms higher highs. This indicates a potential weakening of the current uptrend and might signal a trend reversal or a pullback.
By recognizing these divergence patterns on trading charts, we can gain insights into potential market reversals, entry and exit points, and adjust trading strategies accordingly.
Incorporating Divergence into Your Trading Strategy
To effectively incorporate divergence into your trading, consider the following steps:
Identify the appropriate indicators: Choose reliable indicators such as RSI, MACD, or Stochastic Oscillator that can detect divergence patterns effectively.
Learn to spot divergence: Familiarize yourself with the different types of divergence patterns and practice identifying them on price charts. This will help you develop a trained eye for spotting potential trading opportunities.
Confirm with additional analysis: While divergence can provide valuable signals, it's essential to use other technical analysis tools to confirm your trading decisions. Look for supporting indicators, chart patterns, or trendline breaks that align with the divergence signal.
Set clear entry and exit criteria: Define your entry and exit points based on the divergence signal and your risk tolerance. Consider using stop-loss orders and take-profit levels to manage your trades effectively.
Practice risk management: Implement proper risk management techniques, such as position sizing, to protect your capital. Divergence alone should not be the sole basis for your trading decisions but rather an additional tool in your arsenal.
Backtest and refine your strategy: Test your divergence-based trading strategy on historical price data to assess its effectiveness. Make adjustments as needed and continuously monitor and evaluate your results to improve your trading approach.
Remember, divergence analysis is not foolproof and should be used in conjunction with other technical analysis methods and market factors. Regular practice, continuous learning, and adapting to changing market conditions are crucial for successful trading.
Divergence analysis is a powerful tool that can provide us with an edge in the cryptocurrency market. By understanding and effectively utilizing divergence patterns, we can identify potential trend reversals, improve entry and exit timing, and enhance overall trading strategy. Incorporate divergence analysis into your trading approach and combine it with other technical indicators and risk management techniques for a well-rounded and informed trading strategy.
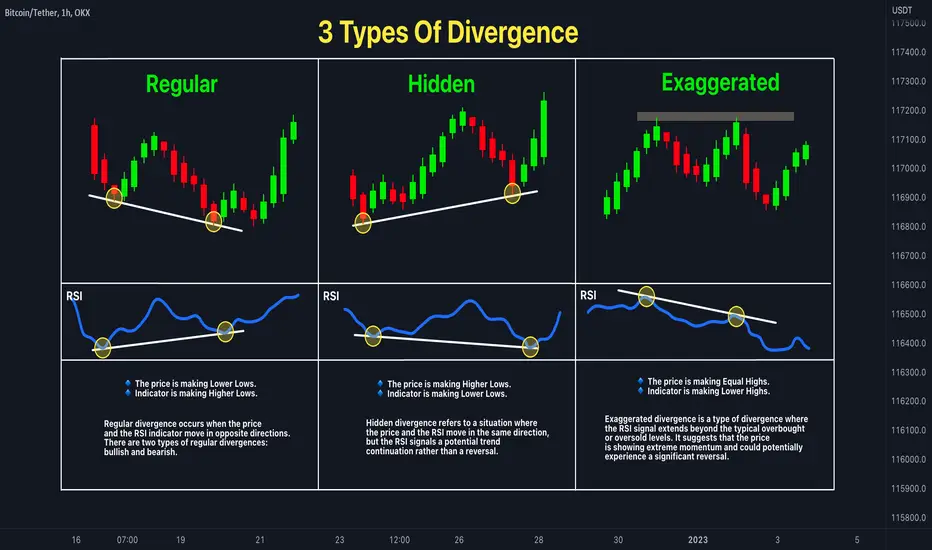
📊 3 Types Of DivergenceRSI (Relative Strength Index) is a commonly used technical indicator in trading that helps identify overbought and oversold conditions in the market. It measures the strength and speed of price movements and provides traders with valuable insights into potential trend reversals. When analyzing RSI, three types of divergences can be observed: regular, hidden, and exaggerated divergences.
📍Regular Divergence: Regular divergence occurs when the price and the RSI indicator move in opposite directions. There are two types of regular divergences: bullish and bearish.
📍Hidden Divergence: Hidden divergence refers to a situation where the price and the RSI move in the same direction, but the RSI signals a potential trend continuation rather than a reversal.
📍Exaggerated Divergence: Exaggerated divergence is a type of divergence where the RSI signal extends beyond the typical overbought or oversold levels. It suggests that the price is showing extreme momentum and could potentially experience a significant reversal.
In summary, regular, hidden, and exaggerated divergences in RSI analysis provide traders with valuable insights into potential trend reversals and continuations. By understanding these divergences, traders can make more informed decisions regarding their trading strategies and positions in the market.
👤 @AlgoBuddy
📅 Daily Ideas about market update, psychology & indicators
❤️ If you appreciate our work, please like, comment and follow ❤️
Introducing the Trendicator (by Stock Justice)In this comprehensive tutorial, we dive deep into the world of the Trendicator, a powerful and innovative trading tool made by @StockJustice that enables traders to identify trends, spot reversals, detect bullish and bearish divergences, and perform multi-timeframe analysis. We delve into the inner workings of this never-before-seen indicator, demystifying its complex algorithms and showing you how to harness its full potential. From understanding the unique features of the Trendicator such as its compression stages, divergences, and MACD crossovers, to learning how to pair it with a Displaced Aggregated Moving Average (DACD) for enhanced precision, we cover it all in a fun and engaging manner.
The tutorial is not just about explaining the Trendicator's functionalities, but it also provides practical tips and strategies for using it in real-world trading scenarios. We discuss how the Trendicator can help traders spot the onset of a trend, gauge its strength, and pinpoint potential reversal points. Additionally, we explain how traders can utilize the bullish and bearish divergences identified by the Trendicator to anticipate market turns and make informed trading decisions.
Lastly, we emphasize the importance of multi-timeframe analysis in trading and demonstrate how the Trendicator can facilitate this process. By interpreting the Trendicator's signals across different timeframes, traders can gain a more comprehensive view of the market and make more accurate predictions. This tutorial is a must-watch for any trader aspiring to level up their technical analysis skills and trade more confidently and effectively. So, get ready to embark on an exciting journey of learning and discovery with the Trendicator!

Introducing the Dynamic Fusion OscillatorHello, it's Stock Justice here! In our latest video, we delve into the world of the Dynamic Fusion Oscillator (DFO) - a tool that blends the power of the Relative Strength Index and the Stochastic Oscillator. I walk you through how it works, from understanding these two base components to how we fuse them to create a balanced and sensitive tool for identifying market trends and reversals.
We dive deep into how the DFO uses moving averages to signal potential bullish or bearish trends, and how divergence within the DFO can indicate trend reversals or continuations. I also touch on the DFO's capacity for multi-timeframe analysis, giving you the bigger picture of market trends.
Wrapping up, I remind you of the DFO's value as a versatile trading tool, but also emphasize the importance of using it alongside proper risk management and other technical analysis components. All in all, this video is a must-watch for traders aiming to enrich their toolkit and navigate the market more effectively!

True Strength Index: Mastering Trend StrengthThe True Strength Index (TSI) is a powerful momentum oscillator that enables traders to identify potential trade opportunities by measuring the strength of a trend. This unique indicator is based on double-smoothed price changes, providing a more accurate representation of momentum in its truest form . In this blog post, we will delve into the world of TSI, exploring its uses, applications in trading strategies, and how it can be combined with other indicators to enhance its signals.
What is the TSI Indicator?
The TSI is a technical analysis tool that captures the ebbs and flows of price action by smoothing price changes, filtering out the noise, and producing a steadier line. The calculation of TSI consists of three key components: the double-smoothed price change, the double-smoothed absolute price change, and the TSI formula itself. As a momentum oscillator, TSI generates trade signals based on overbought/oversold levels, crossovers, and divergences. The TSI itself consists of three parts: the TSI line, the signal line, and a zero line.
How is the TSI Indicator Used?
Professional traders use the TSI indicator to gauge the strength of a trend, assisting with trade management and providing early indications of a trend continuation or reversal. The TSI oscillates between 100 and -100, with bullish and bearish trends indicated by crossings above or below the zero line, respectively. This versatile indicator can be used to hold onto winning trades, anticipate impending trend changes, and identify trend shifts through divergences.
Examples of TSI in Trading Strategies
TSI and Moving Averages:
A widely-used approach integrates the True Strength Index (TSI) with moving averages, such as the 50-day moving average, to substantiate the potency of a trend. For example, assume the TSI value surpasses the zero line, while concurrently, the stock price is higher than its 50-day moving average. In this case, it may suggest the onset of a promising bullish trend. On the other hand, if the TSI dips below the zero line at the same time the stock price falls below its 50-day moving average, this could signify the emergence of a bearish trend.
TSI Divergence:
Divergence occurs when the price and the TSI indicator move in opposite directions. For example, if the price makes a higher high, but the TSI forms a lower high, it could signal a bearish divergence, indicating a potential trend reversal. Similarly, a bullish divergence occurs when the price makes a lower low, but the TSI forms a higher low, suggesting a possible trend change.
TSI and RSI:
Combining the TSI with the Relative Strength Index (RSI) can help traders identify overbought or oversold conditions in the market. When both the TSI and RSI reach extreme levels, it may signal a potential reversal. For example, if the TSI is above 70 and the RSI is above 30, it could indicate overbought conditions and a potential bearish reversal may be imminent. Divergences can also be confirmed by comparing the divergences on the TSI to the divergences on the RSI.
Conclusion:
The True Strength Index (TSI) is an invaluable tool for traders looking to gauge the strength of a trend and identify potential trade opportunities. By understanding its uses and incorporating it into trading strategies alongside other indicators, traders can enhance their decision-making process and improve their overall trading performance.
If you like our educational content don't forget to give us a boost and a follow!

Stochastic RSI in detail and how to use it.The Stoch RSI (Stochastic Relative Strength Index) is a technical analysis indicator used to identify overbought or oversold conditions in financial markets. It is a combination of two popular indicators: the Stochastic Oscillator and the Relative Strength Index (RSI). The Stoch RSI applies the Stochastic Oscillator formula to the RSI values, aiming to provide a more sensitive and faster signal for potential trend reversal.
The Stoch RSI is calculated as follows:
Choose the time period for which you want to calculate the Stoch RSI. The most common period is 14 .
Calculate the RSI: (Detailed post on this in the link below)
Determine the highest and lowest RSI values: Identify the highest and lowest RSI values over the same time period (e.g., 14 days).
Calculate the Stoch RSI: Use the following formula to calculate the Stoch RSI:
Stoch RSI = (Current RSI - Lowest RSI) / (Highest RSI - Lowest RSI)
The resulting Stoch RSI value will range from 0 to 1 (or 0% to 100%). A value above 0.8 (or 80%) typically indicates an overbought condition, suggesting a potential price correction or reversal, while a value below 0.2 (or 20%) indicates an oversold condition, which may represent a buying opportunity.
What does Stoch RSI tell us ?
Stoch RSI is a measure of how fast the RSI is changing. As an analogy. Imagine you are driving your car and have foot on the accelerator which will cause increase in the speed of your cat at every moment, now the rate at which your car's speed increases is acceleration. The bigger the more powerful engine your car has the more acceleration you get and the faster you get to the top speed of your car. So, in this analogy speed of your car at any instant is RSI , acceleration is Stoch RSI and top speed of your car is overbought condition of an asset.
RSI measures who is relatively more aggressive among buyers and sellers at a given instant. Stoch RSI measures how aggressive the buyers or sellers are at a given instant.
So just like in a fight if someone is too aggressive, they are going to spend themselves too quickly and even though they want to fight more they won't be able to until they ease up and relax a bit, this is similar to Stoch RSI of an asset getting to overbought condition and then asset either retraces or takes a pause as buyers are exhausted and need to regain strength by taking profits which turns them into sellers and the asset starts moving in opposite direction.
Why is 80 considered overbought?
The number 80 is chosen based on empirical evidence, suggesting that when the Stoch RSI reaches these extreme values, there is a higher probability of a price reversal or correction. When the Stoch RSI is above 80, it indicates that the asset's price has risen significantly over a short period and could be overextended. In this situation, the asset may be overvalued, and traders may consider selling or taking profits as the price could reverse or correct.
How to use Stoch RSI to enter a trade?
How to enter a Long Trade:
=======================
Step 1. Always use Stoch RSI along with RSI to make a decision:
Step 2. Use it on mid to high term time frame (4h and higher).
Step 3. Make sure both RSI and Stoch RSI are in oversold zone.
Step 4. Make sure the asset is resting on a key support level and holding it.
Step 5. Fearlessly enter the trade.
How to enter a Short Trade:
=======================
Step 1. Always use Stoch RSI along with RSI to make a decision:
Step 2. Use it on mid to high term time frame (4h and higher).
Step 3. Make sure both RSI and Stoch RSI are in overbought zone.
Step 4. Make sure the asset is rejected from a key resistance level and is not able to breach it.
Step 5. Fearlessly enter the trade.
What happens if Support or Resistance is broken in Step 3 above:
=======================================================
That's where divergences come into play.
What is a divergence?
===================
Divergence is a technical analysis concept that occurs when the price of an asset and RSI/Stoch RSI indicator move in opposite directions, indicating a potential trend reversal.
There are two types of divergences: bullish divergence and bearish divergence.
Bullish divergence occurs when the price of an asset makes a new low while the RSI/Stoch RSI indicator makes a higher low. Remember from explanation provided in sections above, this suggests that even though the price is going lower there
are more buying activities than selling and the assets are becoming stronger, and a potential trend reversal may be imminent.
Bearish divergence, on the other hand, occurs when the price of an asset makes a new high while the RSI/Stoch RSI indicator makes a lower high.
I have highlighted bullish divergence in chart with purple line. Shown in Red line is bullish Divergence in Stoch RSI, when RSI is not fully oversold, this can happen when a new support is being formed on the chart due to changes in fundamentals of the underlying asset or some news events.
Bullish and Bearish Divergences are even more powerful signals for taking trades, but we must make sure price is holding a support or rejecting from a resistance before taking the trades, otherwise divergences can easily disappear.
Why do traders fail to effectively use RSI?
The primary reason is lack of experience in trading.
Which leads to impatient behavior.
Not knowing how to mark key support/resistance levels.
No risk management skills. (Taking too much risk)
Lack of trust in self when taking trades, (Keep stopping losses too tight which knocks them out of the trades).
I have shown several instances where RSI generated long signals and all of them were successful, the only reason a trader would not be able to use RSI effectively is because of the above reasons.
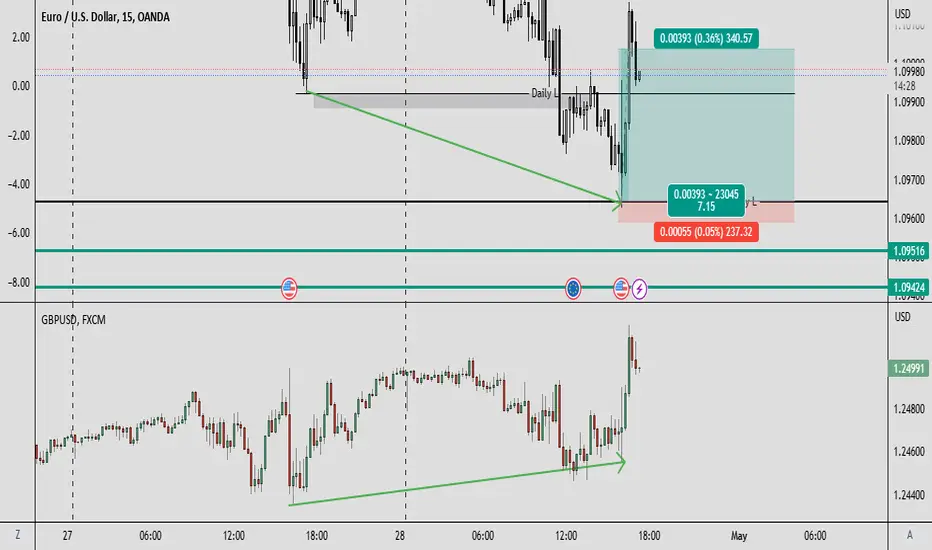
EURUSD and GBPUSD divergence strategyEURUSD and GBPUSD are two highly correlated pairs. So a divergence in these two can be an alert for a big reverse of price usually for the one which makes a higher high or a lower low.
It is a confirmation when the price is closing to a supply or demand level like daily or weekly high or low!
How to Trade With Relative Strength Index (RSI) Indicator
Hey traders,
Relative strength index is a classic technical indicator.
It is frequently applied to spot a market reversal.
RSI divergence is considered to be a quite reliable signal of a coming trend violation and change.
Though newbie traders think that the application of the divergence is quite complicated, in practice, you can easily identify it with the following tips:
💠First of all, let's start with the settings.
For the input, we will take 7/close.
For the levels, we will take 80/20.
Then about the preconditions:
1️⃣ Firstly, the market must trade in a trend ( bullish or bearish )
with a sequence of lower lows / lower highs ( bearish trend ) or higher highs / higher lows ( bullish trend ).
2️⃣ Secondly, RSI must reach the overbought/oversold condition (80/20 levels) with one of the higher highs/higher lows.
3️⃣ Thirdly, with a consequent market higher high / lower low, RSI must show the lower high / higher low instead.
➡️ Once all these conditions are met, you spotted RSI Divergence.
A strong counter-trend movement will be expected.
Also, I should say something about a time frame selection.
Personally, I prefer to apply it on a daily time frame, however, I know that scalpers apply divergence on intraday time frames as well.
❗️Remember, that it is preferable to trade the divergence in a combination with some price action pattern or some other reversal signal.
Let me know, traders, what do you want to learn in the next educational post?

Trading Divergence Divergence is one of the well-known and widely used methods for determining price reversal areas, whether positive or negative and thus helps to determine entry or exit areas 📉📈
Divergence is when the price of an asset is moving in the opposite direction of a technical indicator, such as an oscillator, or is moving contrary to other data. Divergence warns that the current price trend may be weakening, and in some cases may lead to the price changing direction.
There is positive and negative divergence. Positive divergence indicates a move higher in the price of the asset is possible. Negative divergence signals that a move lower in the asset is possible.
Divergence is one of the many trading methods that we use to build an integrated strategy, and of course, we can use it in any time frame we want ✍️

Educational (divergence + volume)Hi guys, in order to spot a divergence you should be careful which timeframe you're looking at. for example in the left picture, the daily timeframe is showing higher highs in price (at each candle) and lower highs in RSI (at each candle). but note that these are not highs and lows and as long as you can't find signs of accumulation and distribution in highs and lows (as long as there's no valid consolidation) you can't name them as highs and lows. so there's no divergence. but in the lower time frame (what is shown is 4h) you can see it more clearer that for every candle in the daily time frame, you have a specific trend in the 4H timeframe. so you can name them as highs and lows and yes, there is a divergence now.
also, keep in mind that in the lower timeframe. every time you're making a new high in rsi, you should expect it to be more volatile and be more sensitive in a way that in the next new rsi high, you have less time spent in the overbought area.
The next part is about the volume profile. you have less resistance in front of the price movement where there is less volume traded in the past. BUT NOT ALWAYS!
less trades made in the past in an area means two things:
1- you can expect the price to move faster and sharper and take less time in that area
2- if the price wants to make a low or high or a pattern, it's less predictable and there's more chance of wrong analysis and fake patterns.
Feel free to leave any comments and ask questions!

Flawed concepts: divergences One of the reasons why a divergence on an "indicator" hasn't provided an expected result is because there was an info conflict with more data on lower resolution (aka higher timeframe was against it).
The second reason is because these indicators don't know how to distinguish buying and selling waves properly, when they start and when they end, as explained in "Real waves". Even if you pass the correctly approximated typical wave size as a lookback window length, it won't change anything 4 real.
The third reason is because these indicators actually are not supposed to be used for comparative analysis. They are what they are, they approximate slope aka direction aka gradient in given data, and some also calculate some sort of statistical limits for these historical slope values. If that's what you really need, you can simple calculate Z-scores of Close minus Open values over some lookback window, you'll do better.
As explained in "Wave exhaustion", a wave (continuous directional movement) strength is understood based on:
1) How far the price gone;
2) How much time passed;
3) How much volume got traded during this wave.
The indicators will show you a correct divergence when 2 waves have the same volume, same price range, but different time range. Volumes are completely disregarded. And most importantly, even if when volumes are the same, time is the same, but price ranges are different, it will Not show you a divergence at all. So effectively, even disregarding volume, price & time are combined in these indicators that way so comparative analysis of waves can not be done.
Many have a wrong idea is that if prices move fast (they call it strong momentum) it means motive strength. It neither confirms strength nor denies it. Time, price & volume are used together to properly understand the order flow strength, in a way explained before.

What Is the Best Divergence Trading Strategy? 👑 What Is Divergence?
Divergence is a trading phenomenon that offers reliable and high-quality information regarding trading signals. It refers to when an asset’s price moves in the opposite direction to the momentum indicators or oscillators. Commonly used indicators include the relative strength index (RSI), stochastic oscillator, Awesome Oscillator (AO), and moving average convergence divergence (MACD).
Divergence is one of the many concepts that experienced traders use to the time when to enter or exit the market. To say a divergence occurs is to say that the price and momentum are out of sync. This signals that the market is preparing for a trend reversal or pullback, but it does not necessarily guarantee trend directions.
There are mainly two types of divergence:
1) Regular divergence is where the price signal creates higher highs or lower lows while the indicator makes lower highs or higher lows respectively.
2) Hidden divergence, which is the opposite of regular divergence, is where the indicator makes higher highs or lower lows while the price action creates lower highs or higher lows respectively.
Regular Divergence vs. Hidden Divergence
What Is Regular Divergence?
Regular divergence can be divided into two types: regular bearish divergence and regular bullish divergence.
What is Regular Bearish Divergence?
Regular bearish divergence occurs when the price action makes successively higher highs while the indicator makes consecutively lower highs. This suggests that the asset’s price is preparing for a reversal into a downtrend. The indicator signal means that the momentum is changing. Even though the price action has made higher highs, the uptrend may be weak. In this scenario, traders should get ready to go short, i.e., to sell the asset and repurchase it later at a lower price.
What is Regular Bullish Divergence?
Regular bullish divergence happens when the price action forms progressively lower lows while the indicator creates higher lows. This implies that the prices will move in an upward trend soon. The indicator action implies that the price needs to catch up with the indicator signal and that the downtrend is weak. In this scenario, traders should get ready to go long, i.e., to buy the asset.
How to Trade Regular Divergence?
Divergence only tells traders that the momentum of a price movement is weakening. This does not necessarily lead to a strong reversal, and the price movement may just be entering a sideways trend (horizontal price movement within a stable range). To create a more reliable divergence trading strategy, skilled traders combine indicators with various tools. Regular bullish divergence and regular bearish divergence have different entry rules. In any case, once a trader has spotted a divergence, they should consider how to enter or exit the market and place their Stop Loss or Take Profit orders.
What’s a hidden divergence?
Divergences not only signal a potential trend reversal but can also be used as a possible sign for a trend continuation (price continues to move in its current direction).
Hidden bullish divergence happens when the price is making a higher low (HL), but the oscillator is showing a lower low (LL).
Hidden Bearish Divergence occurs when price makes a lower high (LH), but the oscillator is making a higher high (HH).
Keep in mind that regular divergences are possible signals for trend reversals while hidden divergences signal trend continuation.
Regular divergences = signal possible trend reversal
Hidden divergences = signal possible trend continuation
Conclusion
Trading divergence can be very profitable if traders can reliably identify divergence by making use of the trading tools in their arsenal. However, like all trading strategies, using divergence indicators involves a certain degree of risk. [

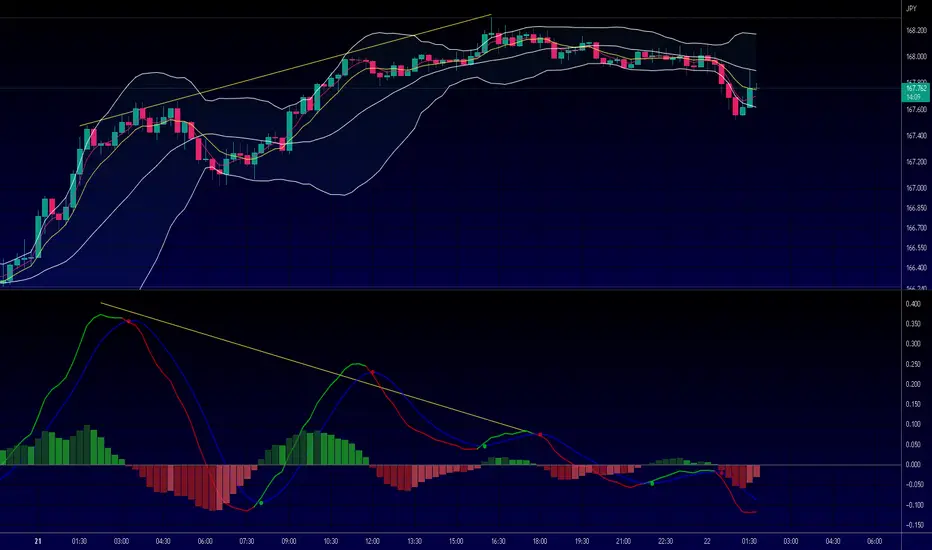
Bearish Divergence Example On GBPJPYIn this bearish divergence example on GBPJPY you can see the price rising on the 15 minute chart while the MACD slow and fast lines are decreasing. After that you can see the momentum on the MACD formed a bearish cross as the fast line fell below the slow line, after that there was a strong 70 pip decline.
When a divergence isn't a divergence and price winsA fellow trader here on Trading View needed some help with a trade he is taking.
Commonly when an RSI makes a new LOW and price makes an opposing HIGH this is called a "Bearish Divergence"
When this happens, its expected that price will follow and make new Lows or start moving down.
But what happens when price continues to move up?
Why would it go against the momentum of the all mighty RSI?
How is it possible that price can reject what the RSI wants to do?
Well the answer is VOLUME and who is in control of it. The Bulls or the Bears...and whomever is in control, will always win.
In this video you'll see something else to look out for when trading divergences so you can predicts which way price will breakout.

The easiest way to spot divergences and how to trade them
Welcome to the coffee shop everybody. This is your host and baristo Eric, and in today's video I am giving you a video Lesson based off of my preferences on how you should look for and use RSI Divergences.
THe Oscillator used in this video is The Heiken Ashi Algo Oscillator
Get it free here and always BOOOOOOOOOOST IT!!
There are three problems that people have whether they are experts or when they are novices in spotting Divergence between the RSI and price.
First problem is they don't know where to look because the RS I can have hundreds of high values and hundreds of low values but you need to know which ones are the relevant ones to look at.
The second problem is a common question where people ask "which way will the price go?"
The answer to that is basically the slope of the RSI is the new slope of your price so, if the RSI is angled up your price will angle up. If the RSI is angled down your price will angle down.
Now hold on a minute don't run off and start acting like you know how to trade divergences yet because there's still question number 3.
When will it go in that direction?
Just because you see a Divergence doesn't mean it's going to immediately happen so you need to know what to look for to let you know that it is actually going to go in that direction and when will that Trend begin. So in today's video I do a nice lengthy coverage on how to spot those answers and you can use the oscillator in the video by going to this link.

Bitcoin - For Trading Not for InvestingWhen Bitcoin was trading at around 60,000 level in late 2021 and before that year, whenever friends, acquaintance and participants asked my opinion about investing into cryptocurrency, immediately I knew they may not know much about cryptocurrency.
To clarify, I am not an expert in cryptocurrency, but I know its intrinsic value could not be calculated then and even today, therefore it is an instrument not for investing but for trading.
Let me elaborate, as long as we cannot define its intrinsic value to any so-call an asset, it is not an asset, but an instrument for trading.
When we get into trading, meaning, we have to acknowledge the getting in and out, out also represent to exit the market with either a profit or a loss, it is part of the deal in trading – we have to be quick when we make a wrong decision.
However, if you position yourself as an investor in crypto, you will either always perceive it will break new high or hope that it will someday go back to its former glory.
Throughout the whole tutorial, I will do a recap on how I have spotted this top here in November 2021. I have done this in another personal forum I have back then.
I will go through that and it may seem like a hindsight view, but I will apply the same strategy to the current market using just trendline and divergence.
Bitcoin Futures
Minimum Tick:
$5.00 = US$25
or $1.00 = US$5
Contract Value:
20,000 x US$5 = US$100,000
Disclaimer:
• What presented here is not a recommendation, please consult your licensed broker.
• Our mission is to create lateral thinking skills for every investor and trader, knowing when to take a calculated risk with market uncertainty and a bolder risk when opportunity arises.

Intra-Day Trading TheoryTrading opinions can be made in a very concrete or a structured manner just like how investors study into the financial numbers of the stock they are about to invest into.
Short-term traders also have its numbers they study into, it is the price behaviours or the price data of the instrument they are trading. When these data are converted into a pictorial format, it becomes a chart.
And I am going to share with you a simple illustration on intra-day trading using trendline and divergence, to derive entries.
You will find how this can be done in a very structured manner and you don’t have to guess too much into it.
I have included some links below on my previous videos on trendlines and divergence.
The first rule:
The first about intra-day trading theory is we have to acknowledge the word “intra-day”, meaning all trades are done within the day itself, and we will have to square off all our positions before the market closes. This is Because we do not wish to carry any risks overnight with unexpected gaps.
Micro E-Mini Nasdaq
0.25 = US$0.50
1.00 = US$2
Disclaimer:
• What presented here is not a recommendation, please consult your licensed broker.
• Our mission is to create lateral thinking skills for every investor and trader, knowing when to take a calculated risk with market uncertainty and a bolder risk when opportunity arises.

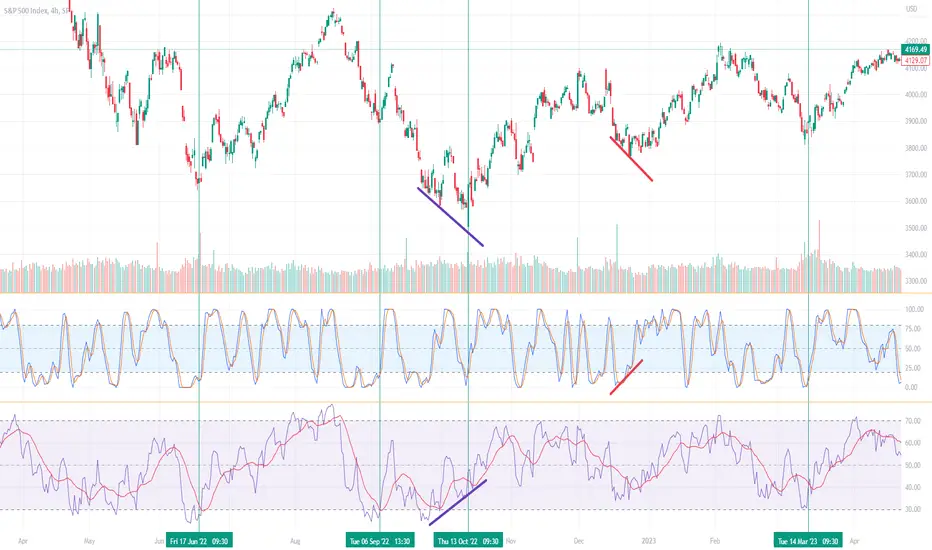
Is this recent rally a bull rebound of a bear retracement? To make an assessment if the market has turned bear, during the closing second quarter on 29th June 2022, we discussed on the topic “Using S&P to Identify Recession
and on the 19 Jul, 2 weeks ago the tutorial posted here, we studied and expecting this current rebound, topic “Nasdaq a leading indicator of Dow Jones, S&P & Russell”.
In today’s tutorial, I thought of doing a recap between the two videos and explore if the current market and its development, if it is a bull rebound heading to break another new all-time high or if it is a bear retracement?
I have included both the video links below.
Before we get into this topic, please also take some time to read through the disclaimer in the description box below.
Disclaimer:
• What presented here is not a recommendation, please consult your licensed broker.
• Our mission is to create lateral thinking skills for every investor and trader, knowing when to take a calculated risk with market uncertainty and a bolder risk when opportunity arises.
Tutorial example:
Micro E-Mini Nasdaq
0.25 = US$0.50
1.00 = US$2
(12,900 - 11,900) x US$2
=US$2,000
(Note: Opposite is also true)
• During the closing second quarter in June, on 29 Jun - “Using S&P to Identify Recession
• On the 19 Jul, 2 weeks ago - “Nasdaq a leading indicator of Dow Jones, S&P & Russell”

Can Interest Rate Be Traded Or Invested?How can we participate in the rise and fall of interest rate? Firstly, we need to understand the difference between interest rate and yield.
Interest rates are a benchmark for borrowers whereas yield is for investors or lenders.
• Interest rates are the fees charged, as a percentage from a lender for a loan.
• Yield is the percentage of earnings a person receives for lending money.
Both move in tandem together, meaning if yield moves higher, interest rates will follow.
Discussion:
• Direction of the Yield in the short-term and
• Direction of the Yield in the long-term
Divergence in a bull market means the bull is losing its momentum, keep a look-out for trigger points that may cause further stress to the market.
Micro 10-Year Yield Futures
1/10 of 1bp = US$1 or
0.001% = US$1
3.000% to 3.050% = US$50
3.000% to 4.000% = US$1,000
Note:
Micro Treasury futures are not micro-sized U.S. Treasury securities. They convey no rights of ownership, nor or they pay or accrue interest.
Disclaimer:
• What presented here is not a recommendation, please consult your licensed broker.
• Our mission is to create lateral thinking skills for every investor and trader, knowing when to take a calculated risk with market uncertainty and a bolder risk when opportunity arises.

How to Trade Bullish DivergenceAt some point in your trading career, you will hear the term "Divergence Trading". Divergence simply means when the price and indicator are telling the trader two different things. It can be an effective addition to your trading strategy, especially if already using indicators like RSI or MACD to find overbought and oversold levels but should not be replied on by itself and requires practice to get it right.
There are two types of Divergence you want to be familiar with: Regular bullish and bearish divergence and Hidden bullish and bearish divergence. In this educational tutorial, I will cover Bullish Divergence. You should note that the appearance of divergence doesn't happen 100% of the time, but when it does, you can use it for additional confluence (extra confirmation) for entering trades.
Bullish Divergence Overview:
A bullish divergence occurs when prices fall to a new low while an oscillator fails to reach a new low. This situation demonstrates that bears are losing power, and that bulls are ready to control the market again—often a bullish divergence marks the end of a downtrend. Notice in this example of GBPCAD, the price was in a downtrend and eventually came to a low at 5494 and rejected the area. The price shows a decline, while the RSI shows the oscillator moving higher. This is an example of regular bullish divergence, as it signaled a potential trend reversal.
How to Draw Bullish Divergence
You want to draw lines on successive tops and bottoms. Connect the tops and bottoms only, and keep your eyes on the price. If you draw a line connecting two lows on price, you MUST draw a line connecting two lows on the indicator. They have to match! Divergence only exists if the SLOPE of the line connecting the indicator tops/bottoms DIFFERS from the SLOPE of the line connecting the price tops/bottoms.
Popular Indicators to Use When Identifying Divergence
You can use indicators such as RSI, MACD, CCI, or Stochastic to trade divergence. Your selection in one of these indicators will depend on personal preference. I personally prefer the RSI at a 7 period.
If you spot divergence but the price has already reversed and moved in one direction for some time, the divergence should be considered played out.
You missed the boat this time. All you can do now is wait for another swing high/low to form and start your divergence search over.
What is your favorite way to trade Divergence? Let me know in the comments!
Happy Trading! :) - Brian & Kenya, BK FOREX ACADEMY

Negative Divergences Often Warn of Declines: Bitcoin & Gold Negative Divergences Often Warn of Impending Declines: Bitcoin Highlighted…. Is Gold Next?
OTC:GBTC
COMEX:GC1!
INDEX:BTCUSD
The CMT Association is proud to publish this guest post from Louise Yamada CMT. Louise was a Managing Director and Head of Technical Research for Smith Barney (Citigroup), and while there, was a perennial leader in the Institutional Investor poll and the top-ranked market technician in 2001, 2002, 2003 and 2004. Louise was the 2016 recipient of the CMT Association’s Lifetime Achievement Award.
In these examples we use the moving average convergence divergence (MACD) indicator to illustrate the concept of divergence, to forensically evaluate Bitcoin and to make some forward looking observations on the gold market.
Divergences:
• Negative momentum divergences often warn of impending price consolidations or declines.
• Divergence forms as price moves to a new high while the oscillator fails at a lower high, creating a negative divergence between the oscillator and price.
• Divergences of this type suggest that the underlying momentum may be waning.
Divergences carry different implications depending upon their time frame.
• Daily perspective divergences suggest either a consolidation, or a pullback in an ongoing uptrend.
• Weekly perspective divergences suggest a more sustained consolidation or even a reversal of trend, particularly if important support is violated.
• Monthly divergences have the potential to result in a more sustained decline or even to reverse an uptrend.
MACD sell signals give validity to divergences.
• Monthly signals have much more weight than weekly and daily.
• Monthly divergences don’t always occur prior to monthly MACD sell signals
• But when a sell signal does occur it offers a structural warning.
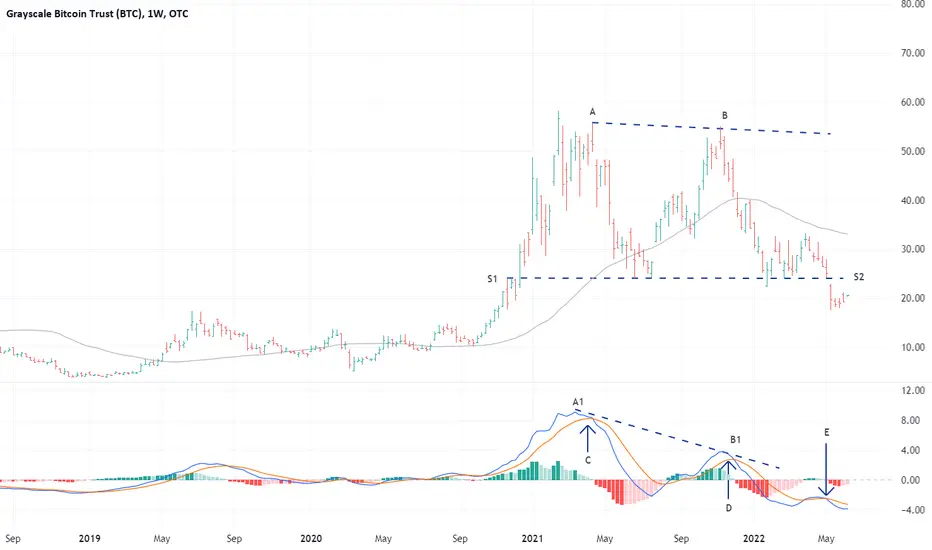
Graystone Bitcoin Trust (GBTC) Weekly:
• The March 2021 high (A) was followed by a roughly equal price high (B). However, the MACD momentum peaked at a significantly lower high (Line A1-B1), forming a classic divergence that suggested that upward momentum was fading.
• At point C, the weekly MACD moved onto a sell signal (the fast moving average crossed below the slower moving average) strongly suggesting that positions should be either lightened or sold.
• After the sell signal was generated, price declined from 50 to 24.
• A weekly MACD buy signal was then generated at point D. The subsequent rally carried price near the prior high.
• The failure of the MACD to match its prior high warned of potential weakness.
• The MACD generated another sell signal at point E, suggesting lightening or selling positions. Price offered another decline from 50 to 24.
• After a multi-week consolidation in March-April 2022, price broke below the support @24 (S1-S2).
• MACD continues to decline, suggesting that the price decline may not be over, notwithstanding interim rallies.
• Before considering a new long, evidence of stabilization at a low and the gradual reversal of the daily, weekly and eventually, monthly MACDs would be required.
Grayscale Bitcoin Trust (GBTC) Daily
• On the daily perspective chart that there is a divergence from price (A-B) and the MACD (C-D)
• The divergence warned of the possibility of bearish developments spreading to the weekly and monthly.
Graystone Bitcoin Trust (GBTC) Monthly:
• The monthly chart also shows a divergence at points MD1 and MD2 and on the histogram at MD3 and MD4.
• At the second price high (B), MACD hadn’t yet generated a sell signal, but it was beginning to flatten and roll over.
• One can also see the falling histogram, as the MACD narrows (blue arrow), and the divergence progressed, until it finally generated a clear sell.
• Price lingered above the support at 24 (S2) for several months providing ample time to adjust positions before the May 2022 price breakdown.
Momentum is still declining, suggesting that it’s too soon to consider re-entry, notwithstanding interim rallies, which can carry into resistance, formerly support.
Graystone Bitcoin Trust (GBTC) relative to SPX Weekly:
• One can also note a similar warning in the weekly Relative Strength (RS) negative divergence.
• In this case the RS for BITCOIN/SPX was also suggesting a change from a period of relative overperformance to one of relative underperformance.
Is Gold Next?
Gold is displaying many of the same long term MACD warning behaviors evident in the GBTC chart.
COMEX Gold Daily:
• Despite the May 2020 (R1) and 2022 (R2) price peaks being roughly equal, the MACD (R3 & R4) peaked at a much lower level.
• A MACD Sell signal occurred after the 2020 peak (R3), alerting to the possible price decline, which eventually carried to the March 2021 low near 1,700 (S1).
• The lower March 2022 MACD peak (R4) also registered a sell signal, suggesting one might lighten positions.
COMEX Gold Monthly:
• There is a monthly multi-year MACD negative divergence between the 2012 (R1) and 2022 (R2) price peaks.
• In 2012, the monthly MACD structural sell signal (R3) was very effective as price collapsed toward 1,100 on the sell signal.
• In March 2022, the MACD, registered another major monthly sell (R4), and then subsequently rallied to test the high (R2) without generating a new buy signal (A), a sign of weakness.
• The MACD has remained negative and appears poised to perhaps continue down.
• This suggests that Gold may be in danger of a potentially large decline, especially if support at 1,700 is broken.
• Such a breach could easily find support at the breakout level from the 2013 to 2019 basing pattern at 1400.
• It is possible, however, that although GOLD has broken out in many other currencies, the extraordinary current strength in the US dollar may be contributing to the Gold disappointment.
Louise Yamada CMT
LYAdvisors LLC
GBPUSD +7.5R - SMT Divergence, SMC, Element of TimeAs promised, here is the breakdown of my trade on GBPUSD :)
Check the links to related ideas for more context.
Make sure you watch the Element of Time tutorial to better understand this breakdown.
