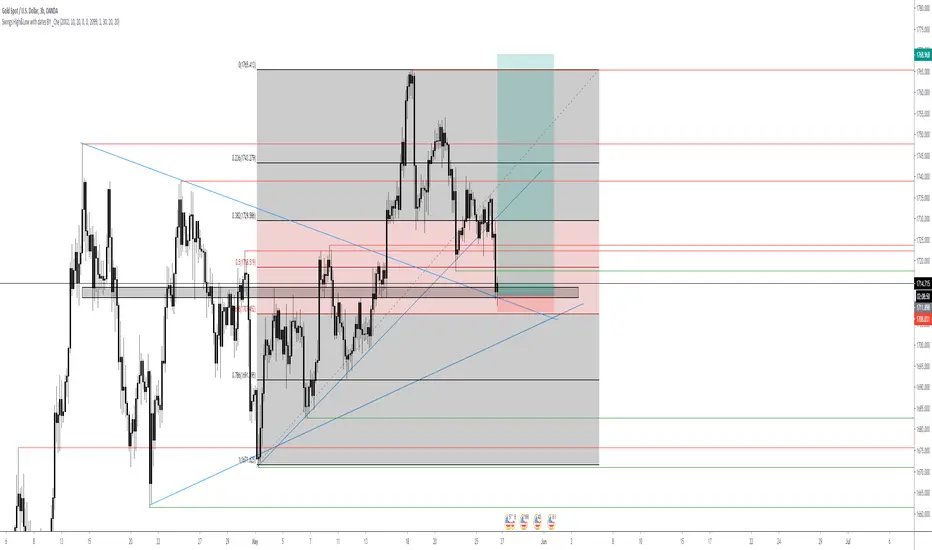
USDJPY!Afternoon!!
I have just set up my analysis for USDJPY! I am waiting for a reversal pattern or exhaustion in price on this candle! I.E a 25% wick to be created from the candle!¬ I am also waiting for resistance to be hit and for it to go back to support!
If this candle brushes pasted my 2 trendlines full bullish we can expect it to go higher so i will get out the trade unless it reverses back into my trendline zones and back into the fib channel!
All set up ready to go!"
Fibs

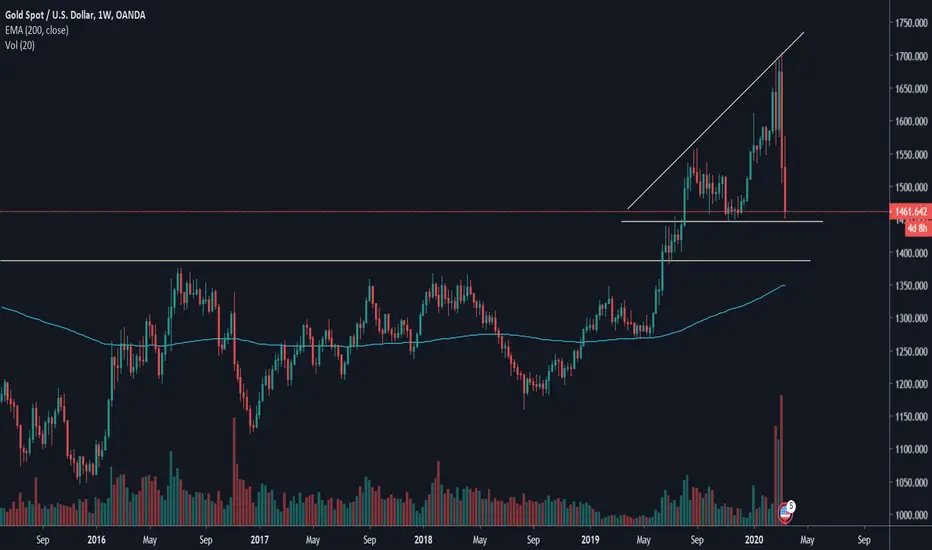
XAUUSD BUY UPDATE
ON previous analysis
it has reversed and hit out trendline! (so it broke out of out 4hr trendline now it has come back and touched it!!
I am in this as!
4 days we go upMy last post i showed that we move on the 10th day and we did and we moved down as expected, 4 days left for another 10th day phase, I believe people will be surprised again to see us go up to 23.5 cent.


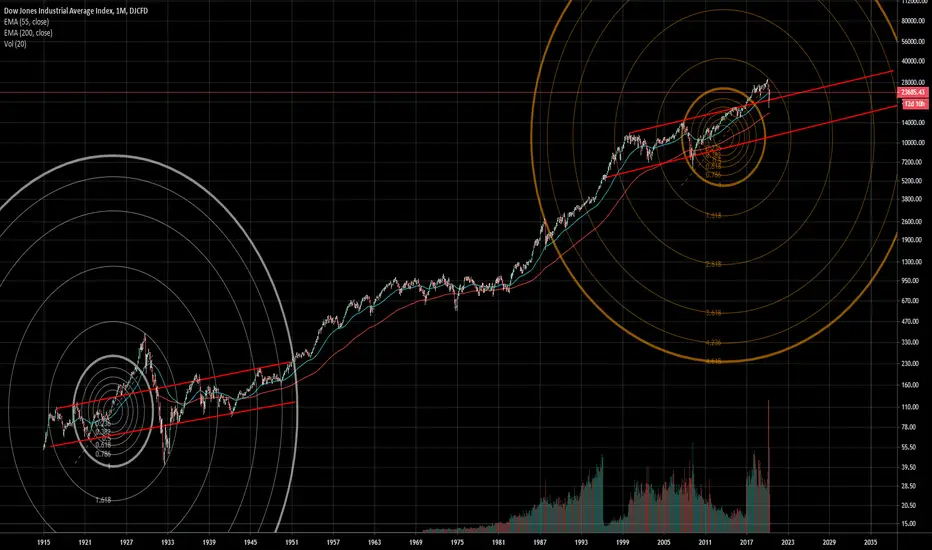
Dow Jones since 1915I think that 2020- Recession shouln't be so bad as Great Depression. Look how high it has jumped out of the channel in 1920s and that's why it sunk so deep below the channel during Depression.
2009-2020 bull run wasn't so over the top as 1920s. Now DJI should go down some below the channel and after crossing the ring we will go up but not as much as in recent run. Just have to wait for red RSI now...
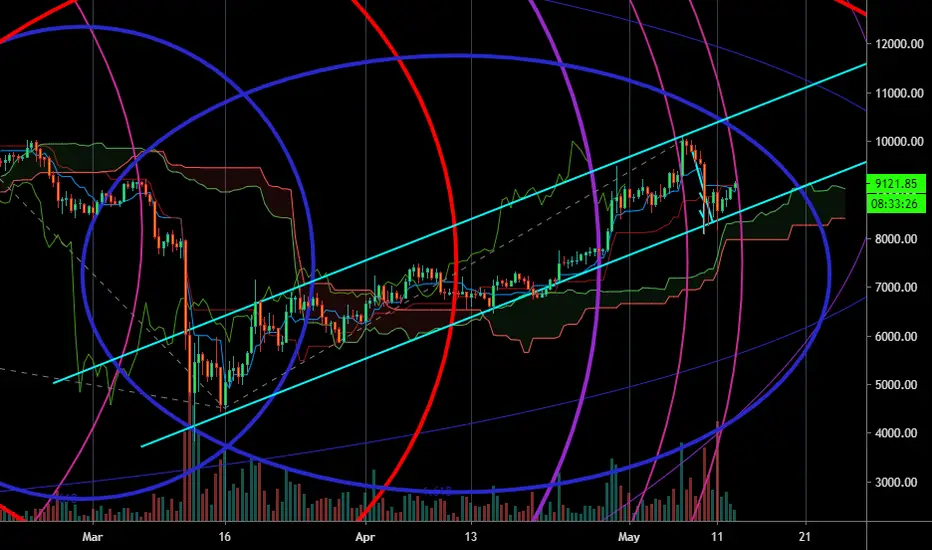
Fibs off last years high/low and this years low/high 12H BTCUSD Watch for large movements along these fib circles.
Add new ones as time progresses.
Make adjustments as needed.
Many parabolic moves happen on major fib circles.
Ichimoku cloud looking bullish as well.
Maintaining this upward channel looks bullish. Placing stops below channel and trailing price.
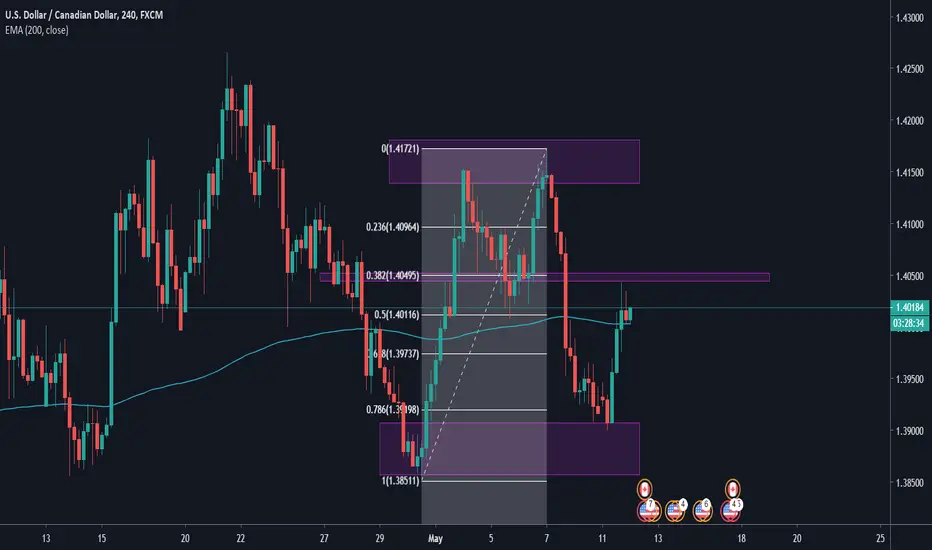
USD/CAD SELL ShortHello,
I see that oportunity on USD/CAD.
On technical analysis we have a double ton already formed and just to test the neck line, as you see on the chart, using fibbs, we can see where is the testing zone.
It could help us also the crude oil and the next period of demand of oil and as you know, If U.S. and not only demand rises, manufacturers will need to order more oil to keep up with demand, this can lead to a rise in oil prices, which might lead to a fall in USD/CAD.
Wait for the testing the zone, after that put your TP at 1.39733, there are a lot of pips, a huge R/R, the SL at 1.40870 .
Entry at 1.40443
TP at 1.39733
SL at 1.40870
Have a great week !
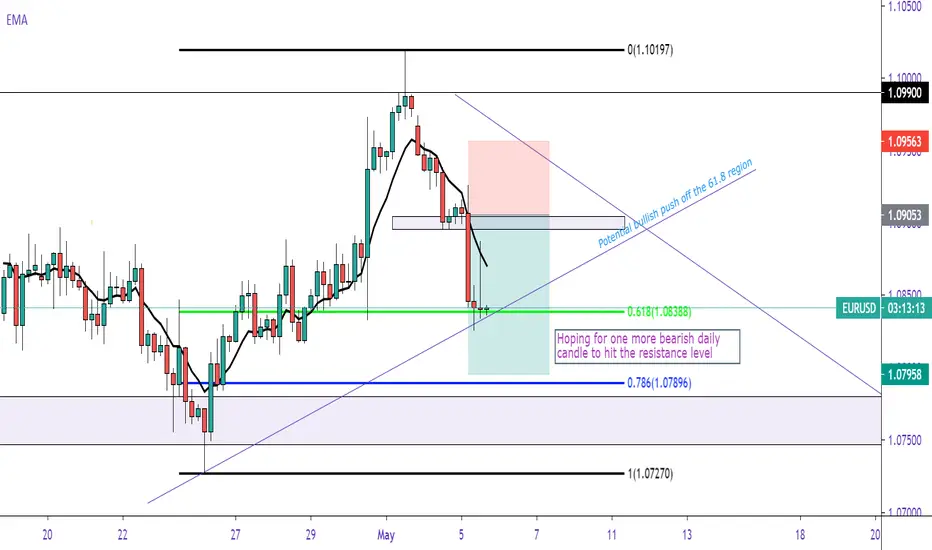
A potential change for EURUSD*All analysis for this was completed on the 4H time frame*
Drew my fib levels from HL to HH of the bullish push. The bearish momentum over those past two days from EU seems to possibly be consolidating in the 61.8 fib region of the chart, noticing this allowed me to see the potential bullish Trend line off the 61.8 fib level. However, this could also be a continuation of the bearish swing which I imagine to continue until 1.07600 overall. But this is just an idea put in place if a retrace does occur at this key level.
CLN0: Potential Pullback Buy SetupThe above charts shows an optimal limit buy area for a swing trade. Looking for a weakness to trigger a long entry while limiting the risk as much as possible is the aim. The 128.70% extension is a good area for setting a safe sell stop; the closer it is to that area, the better the reward for risk taken.

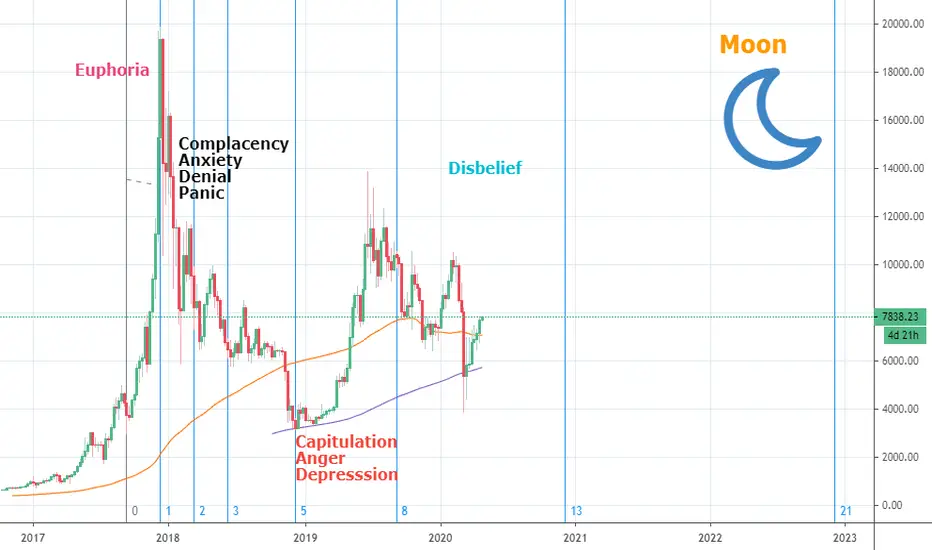
Fibonacci Street Cheat Sheet- Time Cycles to 2022Inspired by the Wall Street Cheat Sheet (static.cryptoglobe.com)
We are applying major Fibonacci pivot points since the top of 2017. Disbelief ends in down days/weeks. Going to shake people out in the ensuing weeks and see the mathematics of the Fibonacci cheat sheet play out.
The Social Traders | US30 ShortI'm paying a very close eye to US30 - we're right on the 78.6%, daily 50 ema, right near a trendline retest and we also have some market structure.The is a possibility that price could pop up to the daily time frame 78.6% fib. Probably vs possible 💭


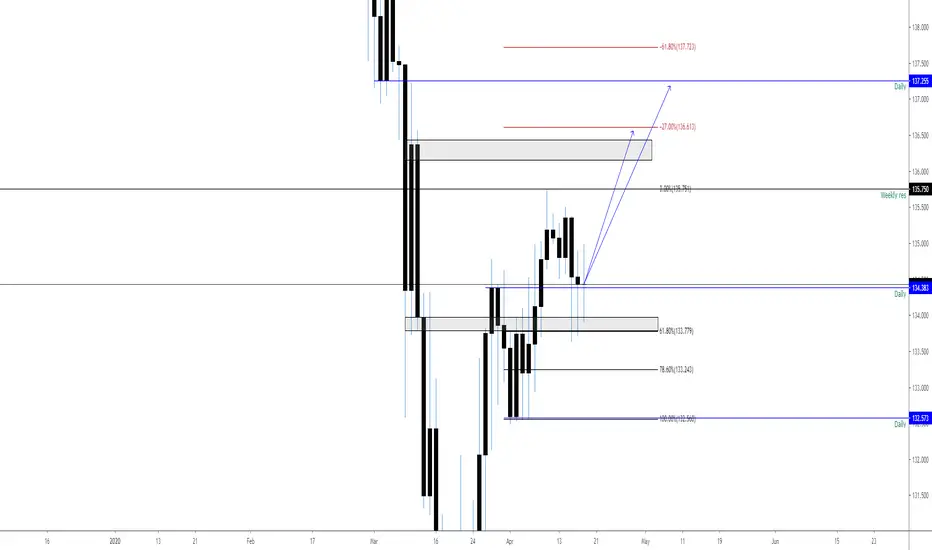
GBP/JPY LongDaily: 3 spikes identifing redjection from 134.38 daily level, 61.8% retracement (133.780) held as support. Expect on upcoming week moves toward 136.500 and 137.250 targets.
NASDAQ Approaches Important Swing TestAfter making a lower low on the large decline and bouncing at the Red Fib's 0.786, the NQ now approaches an important level. This swing test will play a big role in determining whether we can sustain an overall uptrend; or, if we reject, the the new trend is down.
Note that we're approaching two important fib levels:
The Red 0.236
The Yellow 0.786.
I would bet that we see rotation, i.e. failure at the top of the swing - and we plunge lower. The reason I say this from a technical perspective is that we made a lower low of the previous leg; plus, fundamental economic factors (a shattered economy, 16+ million jobless claims) do not bode well for higher highs.


Fibs Don't Work!!just went on my tradingview btc/usdt chart and forgot that id set it up a couple of weeks ago (i've been working and trading on my phone)
:O right on all you people making bogus calls again and again get a Fib up ya!

Gold shortCalled this trade on gold this morning, heading towards profit. Now moved to break even stops

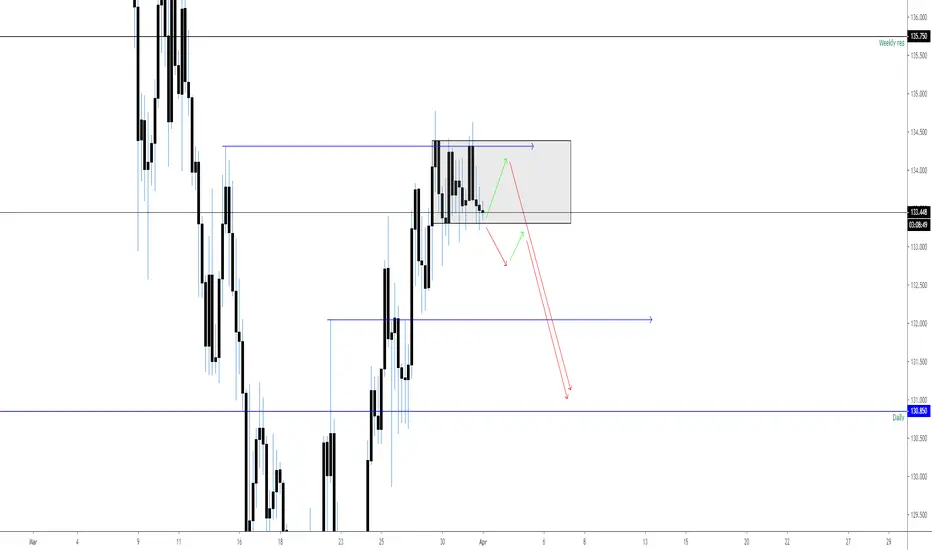
GBP/JPY end 2day consolidation, SHORTGBP/JPY if someone trade this pair, pay attention tomorrow. For the high volatile pair, consolidation goes already 2 day. Potential breakout of square is gonna be massive.
Pay attention pls also to UK Manufacturing PMI (Mar).
USD/CAD potential move to the upsideUSD/CAD good opportunity to catch long trades on correction move to the upside (levels provided). Expect on this levels some sort of consolidation in between.

DATABTC (STREAMR DATACOIN) relevant fibshere we have streamr datacoin.. is this the end of the pump and flags?
gaussian about to cross over on the hourly chart? YOU DECIDE!


XAU/USD SHORTHello !
For today and for the next day, even weeks, i will watch this trade .
On weekly time frame, on 1447-1446 we have an important level of price.
I will enter on this trade only if the 4 H candle close lower that 1446, I set my long TP at 1403 and a short TP at 1434.
My SL it will be at 1482.
Please hit the like and follow buttons if you like my idea !
Have a great and also a safe week !