Position
BeWhere to Track Covid-19Hello guys, BeWhere Holdings design and manufacture tracking beacons that mesures light exposure, battery life, impact, position, temperature and proximity.
Rumors say they have big governement contracts coming. Sell the news.
Trade at your own risks, not investment advice.

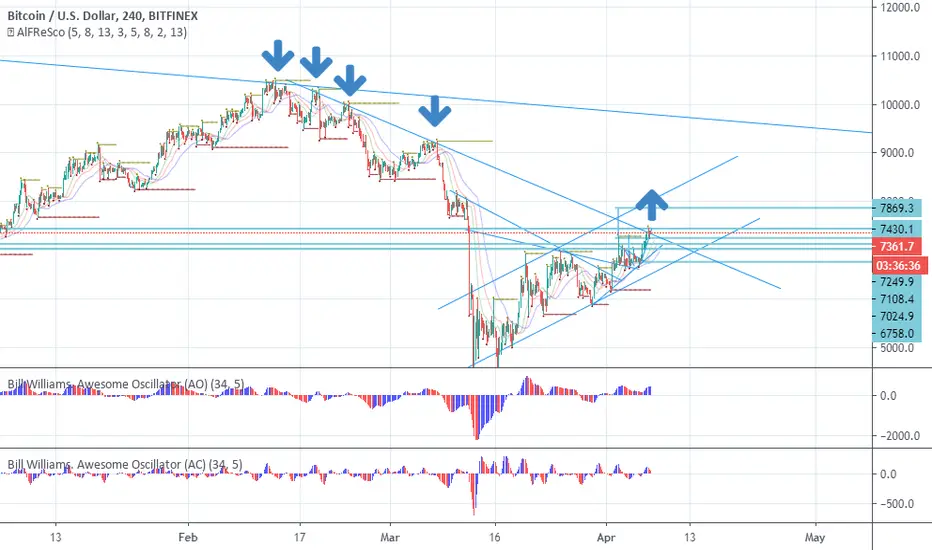
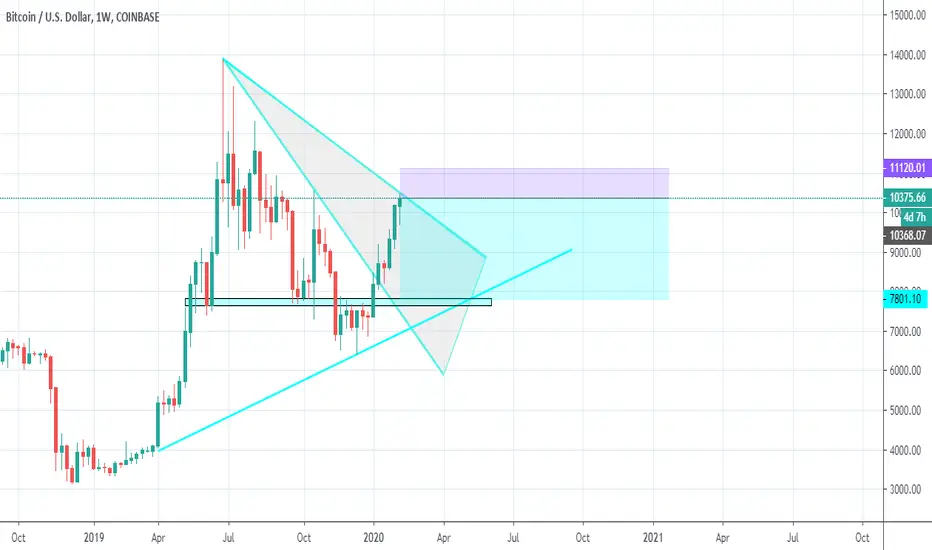
Long position to 9k$ and short position Hi everybody...
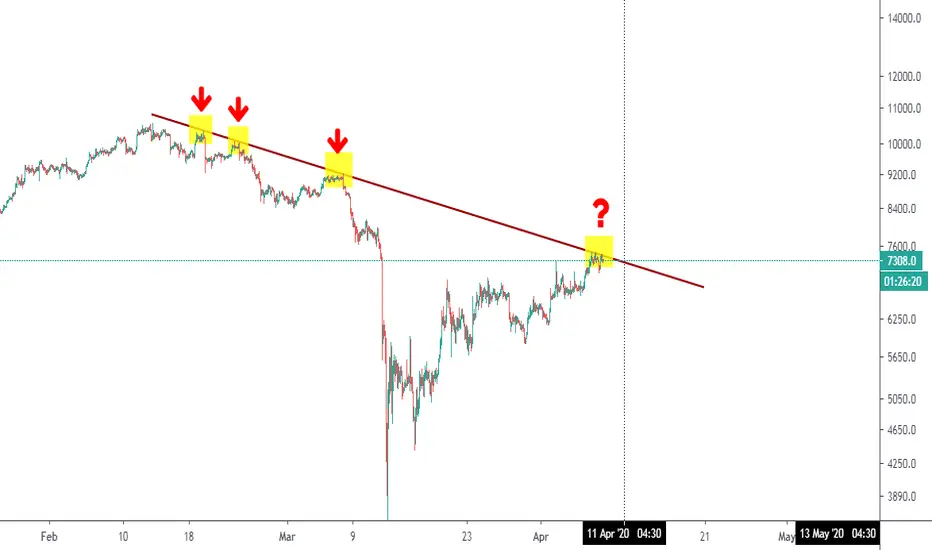
Bitcoin Dominance is 66.6 and I guess up to 67.21 because bitcoin is on 3 important support.
After that, the price will drop. probably
Push ❤️ if you think this is a useful idea!
Before to trade my ideas make your own analysis.
Thanks for your support!

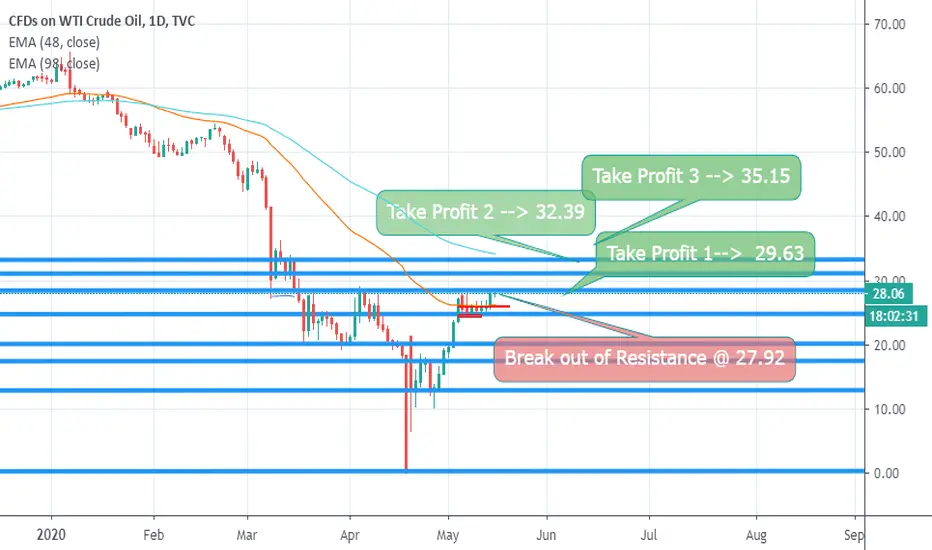
Crude OIL Position Trade Idea Dear Traders,
This is a position trade idea looking at the fundamentals of Oil.
Consumption of Oil will increase since US opens from 15th of May and other EU countries are also open alongside major Asian economies.
Please take this trade on your own risk. This is a position trade idea hence you might have to hold this for a couple of weeks / months.
Enter at current market price or wait for a pull back.
The current rally of oil prices can have a correction at 50 fib level 26.54 or first support level at 26.87.
My Stoploss level is 26.21.
If the price breaks out 27.92 level
The our Take profit levels would be as follows
Tp 1 29.63
Tp 2 32.39
Tp 3 35.15
Dont over leverage your account. If you dont know about Position trading kindly consult a financial advisor.
If you want to take my Services message me with you query.Moreover I would really appreciate your comments and feedback on this trade Idea,
Best of luck for the trade.
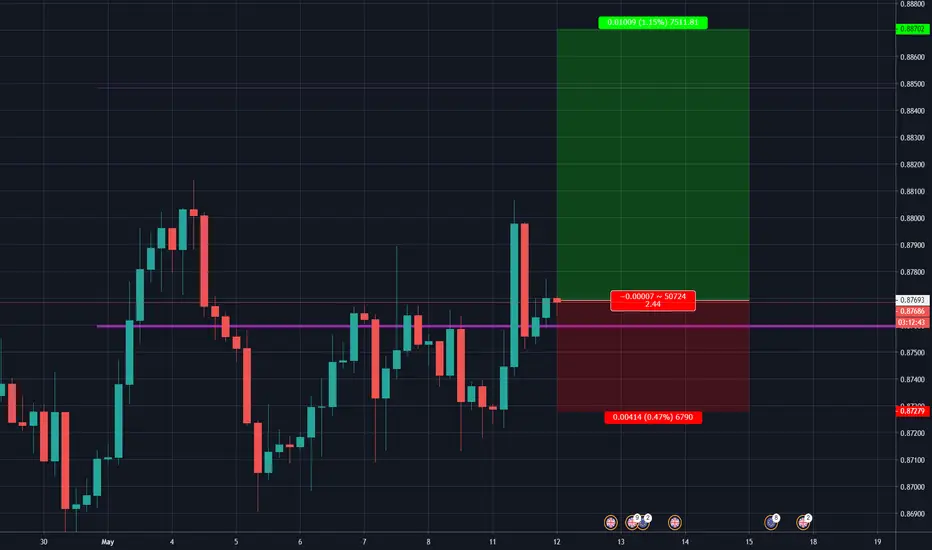
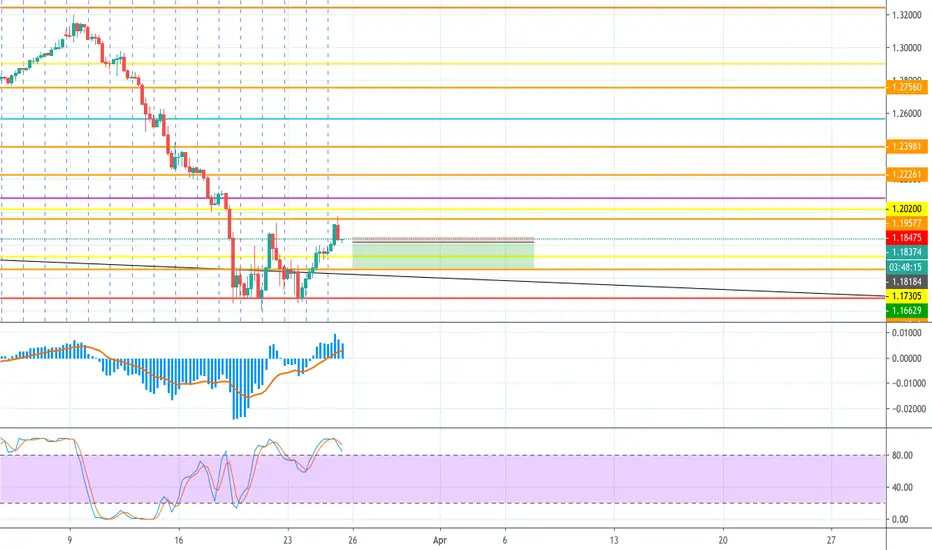
EURGBP long ideaMonthly pivot price broke through long and held, long position idea with stop loss. risk management in place.
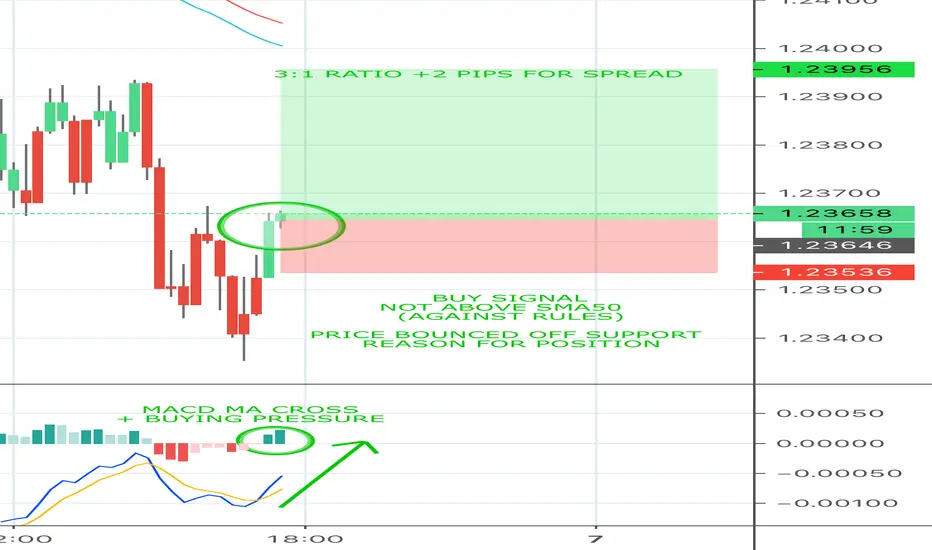
6 GBPUSD 15 LONG Long position based of pure indicator setup.
3:1 trade ratio + 2 pips for spread
Against rules are price is not above SMA50 for long positions, but bounce near higher TF support has supported my position.
Long position 17:31 GMT+1 1.2362
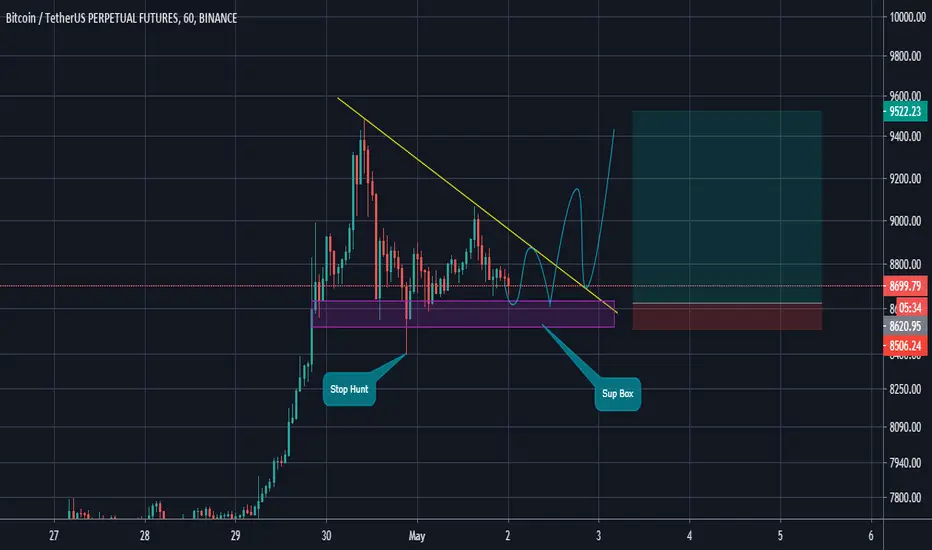
BTC Short-Term Idea We should see somthing like this and price should go up if that box can hold the price , just enter long position after triangel break . good luck
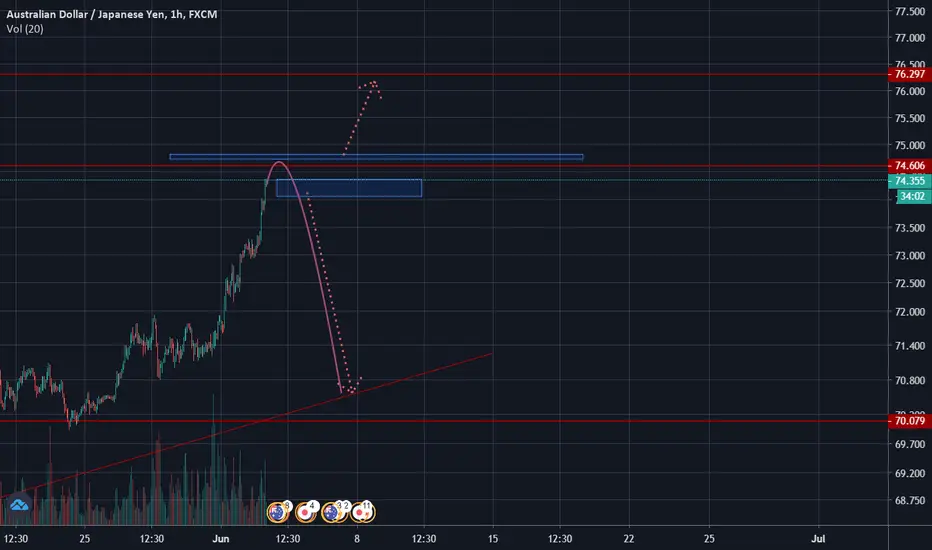
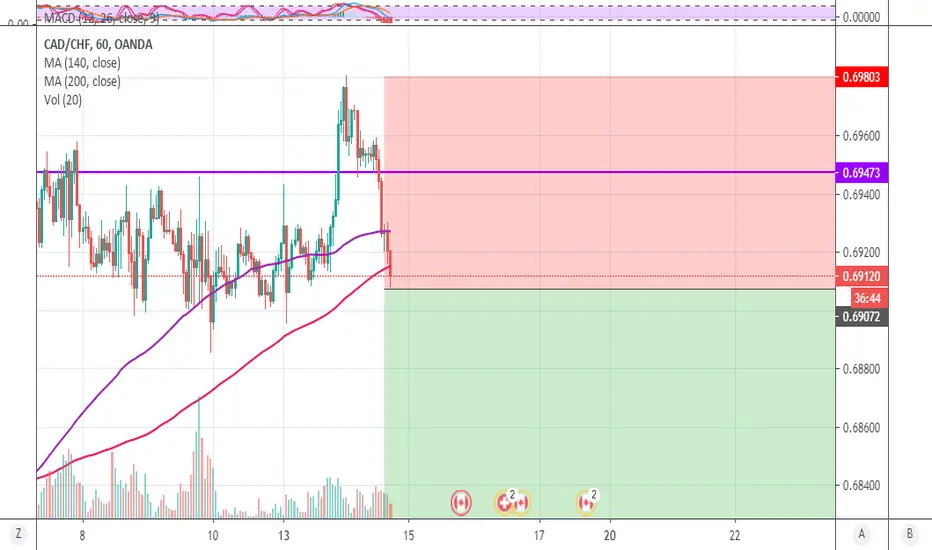
SHORT STORY FOR CAD CHFThe Pair will telecast a good short story in few hours as the correction for CAD CHF is abt to over and the downslide for the pair is abt to begin
Big resistance breakoutbitcoin from $13000 had a big resistance and now it just broken
its mean long position now be good
Opportunities of our life time, buy Silver/Gold/BITCOINBUY Silver, Gold, Bitcoin (accumulate) and Oil, DON'T MISS your chance to get rich and that is ofcourse LONG TERM POSITIONS!
Related ideas.
Gold:
Bitcoin:
Oil:
PS. People who agree with me, please support me and that is a financial advise for long term holders! GOOD LUCK and lets get all rich together!
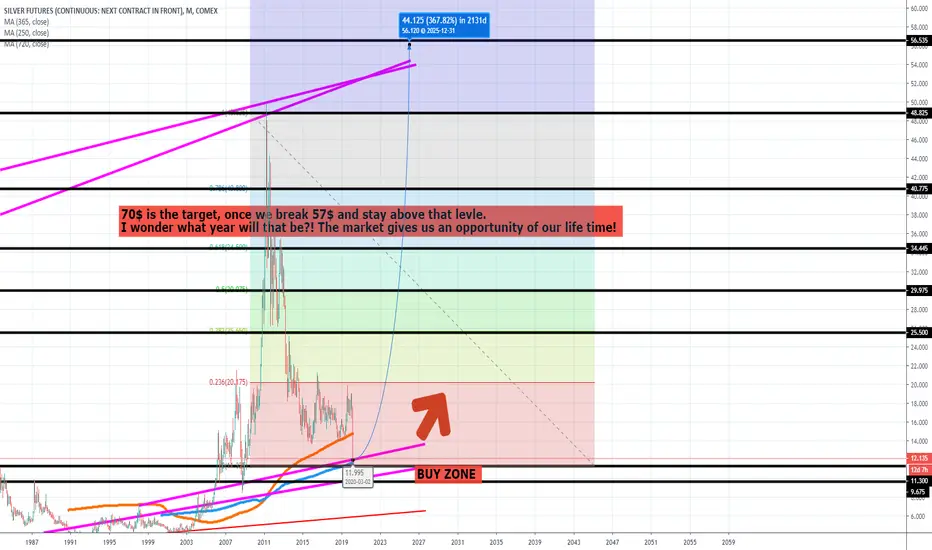
Silver Some interesting historical data on the price of Silver back from 2002- 2003 similar to what we 've seen happening for the last couple of weeks.
Blue line 50 MA
Yellow line 100 MA
Red line 200 MA
time frame weekly
Green circle 50 MA 100 MA golden cross on the weekly ,
Yellow circle 50 MA 200 MA golden cross on the weekly ,
Similarities with today's price action are that :
1 Back then the price got rejected multiple times from the same resistance line before breaking to the upside , as we've seen happening to the price last week .
2 After the 50 MA 200 MA golden cross occurred price gave two weekly bearish candle sticks before going to the upside .
we are currently going through a golden cross between 50 MA and 200 MA on the weekly time frame,
We did create a pretty attractive bullish hammer candle on the 4 hour , but I would stay away for now and wait for further confirmation as this correction might have more to give especially after a weekly engulfing candle. Once the golden cross has confirmed that would be a good time to place a long.

Request: my winners and losinga request on a snapshot in time regarding what my positions are in some of my winners and losers.
trade safe~

STEEM. A major player is gaining a large position of coins.STEEM / BTC accumulation channel exists for 4.5 months. A huge position is being recruited by a major market player. On the chart we see 3 zones of huge volume. We see long shadows. This means that someone bought in the market the lower sell orders that have accumulated. Then the price was lowered back down so as not to make a false start to growth.
Target. There are two options for trading this coin at the moment:
1) The first option . Trade in the accumulation channel in increments of 30-40%.
2) The second option. Entrance during a breakthrough or rollback after a breakthrough of the accumulation channel.
The first target + 50% -100% This is only the beginning of the movement if the trend changes from sideways to upward.
The potential is more than + 3000%. The coin has fallen in price from the last peak more than 40 times! And these were not peak prices at all for the history of trading.
Stop loss
Under key support levels during your entry into the market.


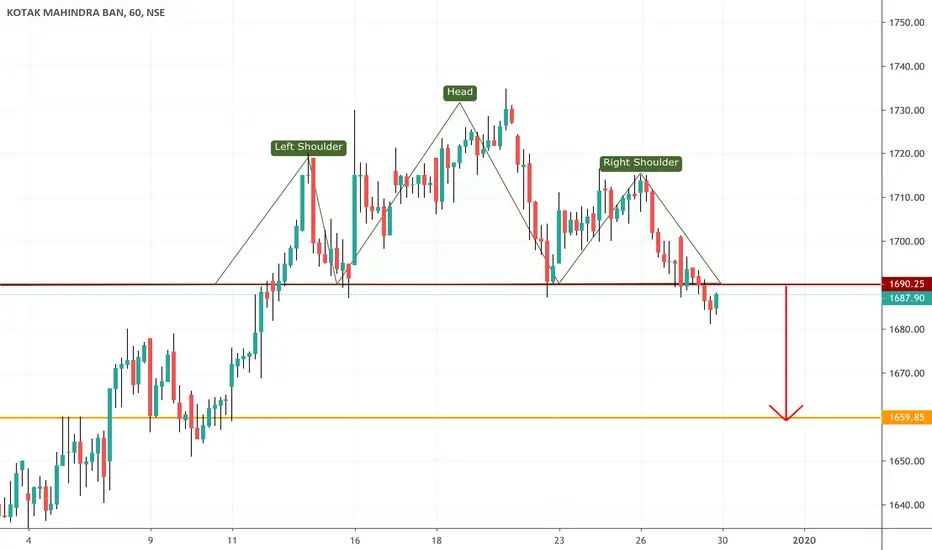
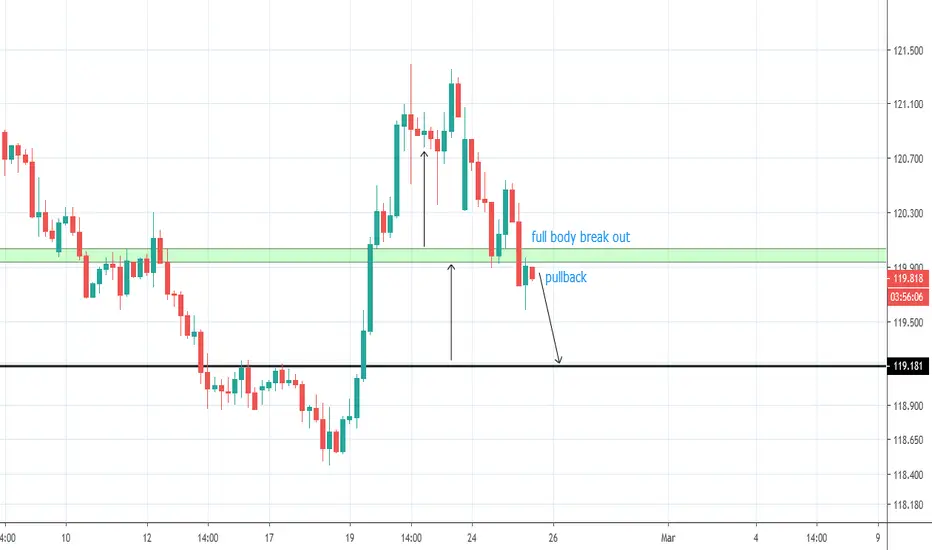
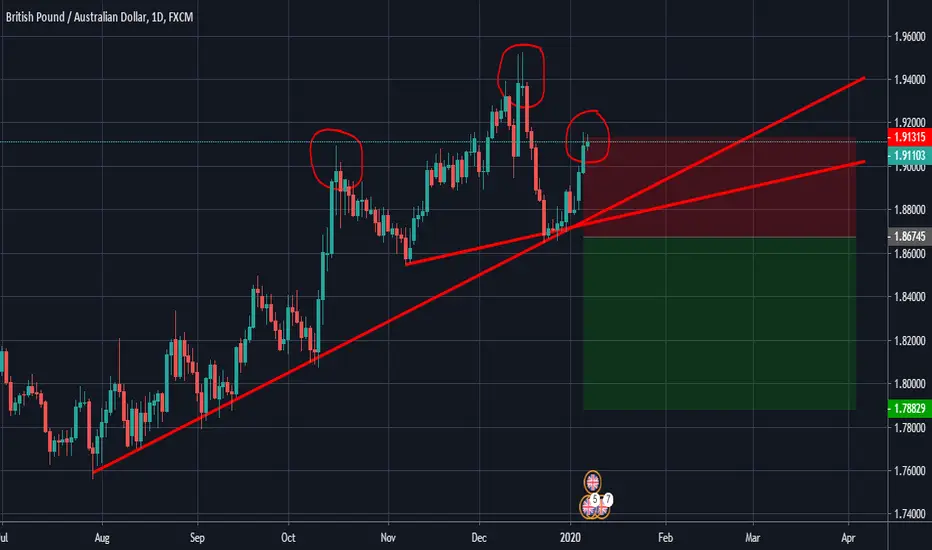
GBPAUD SHORT POSITIONIf we do see the GBPAUD start to rotate lower from the 1.91500 resistance area, we could have a head and shoulders reversal on our hands.
Notice the left shoulder that developed last October.
The head of the pending formation was that multi-year high in December.
But to call this a head and shoulders pattern, sellers need to secure a daily close below what would be the neckline near 1.8700 or thereabouts.
Given the 9000 pip height of the pattern, a close below that 1.87000 area could open the door to the 1.78000 region.
Everyone who saw today’s members-only video knows why that 1.78000 area is significant for the pair.
Just keep in mind that there are no guarantees.
The GBPAUD uptrend is technically still intact, and without a daily close below the neckline, there is no head and shoulders reversal.
WATCH IT AND IF IT UNFOLDS DON'T HESITATE.
KotakBank Go for short after the restest done! don't go for options, use it for positional and intraday