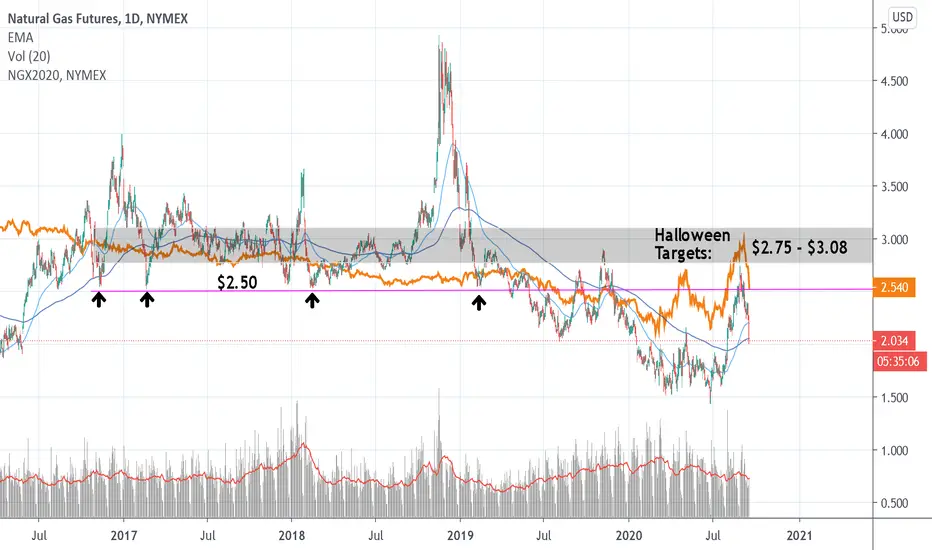
NG Halloween Trick or TreatToday the November(X) contract for Natural Gas corrected down to the historically significant $2.50 level. Going back a couple years it is clear that prices tend to hangout above $2.75 so right now prices are undervalued.
Buying here.
+1 @ $2.53
UNG
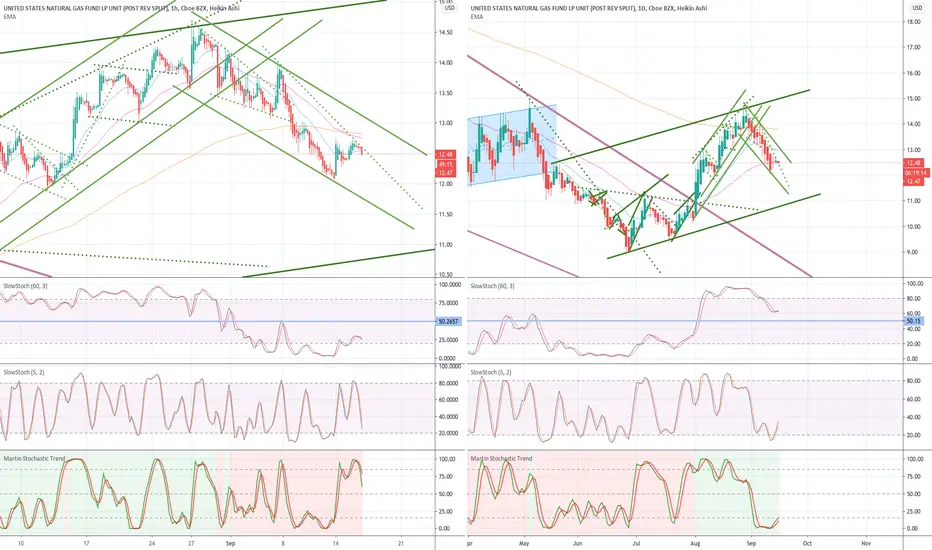
Natural Gas Downtrend ContinuesI still love it. Seriously. But I have to wait and you can see why - the stochastic indicators have only turned up on the daily time frame and we are now caught in this downtrend channel. I've show the lower limit which will hopefully hold, but I would be reluctant taking bearish bets on natural gas from here on in.

NG: UNG: BOIL: Natural Gas Chart Forming a Top?Bullish factors: NG Natural gas price has been rallying for the past month reaching $2.5 level on increased consumption during summer months, improving LNG flows reaching 5.1 bcf/d in mid-August, and two tropical storms in the Gulf area threatening natural gas production. The fundamentals remain bullish going into mid September.
Bearish factors: Production is steady at about 92 bcf/day, while consumption has been declining to 83 bcf/day lately on cooling temperatures. Two tropical storms, Marco and Laura, are not expected to produce substantial disruption to natural gas production, but may produce loss in demand due to cooling temperatures and power outages.
Technical analysis: Divergence between price and volume is pointing toward a potential top. On a daily chart , RSI is above 70, approaching overbought territory. We have an unclosed gap at $2.77 level, which may be the next top.
National demand is expected to be cooling going into September. Overall demand will be driven largely by LNG exports, which are expected to remain steady at around 5 bcf/day, 10-20% below levels seen in the fall of 2019. The forward curve seems to be pricing in a more robust recovery in demand than actually observed.

NG: UNG: BOIL: Natural Gas Chart is Forming a TopBullish factors: NG Natural gas price has been rallying for the past month reaching $2.5 level on increased consumption during summer months, improving LNG flows reaching 5.1 bcf/d in mid-August, and two tropical storms in the Gulf area threatening natural gas production. The fundamentals remain bullish going into mid September.
Bearish factors: Production is steady at about 92 bcf/day, while consumption has been declining to 83 bcf/day lately on cooling temperatures. Two tropical storms, Marco and Laura, are not expected to produce substantial disruption to natural gas production, but may produce loss in demand due to cooling temperatures and power outages.
Technical analysis: Divergence between price and volume is pointing toward a potential top. On a daily chart, RSI is above 70, approaching overbought territory. We have an unclosed gap at $2.77 level, which may be the next top.
National demand is expected to be cooling going into September. Overall demand will be driven largely by LNG exports, which are expected to remain steady at around 5 bcf/day, 10-20% below levels seen in the fall of 2019. The forward curve seems to be pricing in a more robust recovery in demand than actually observed.

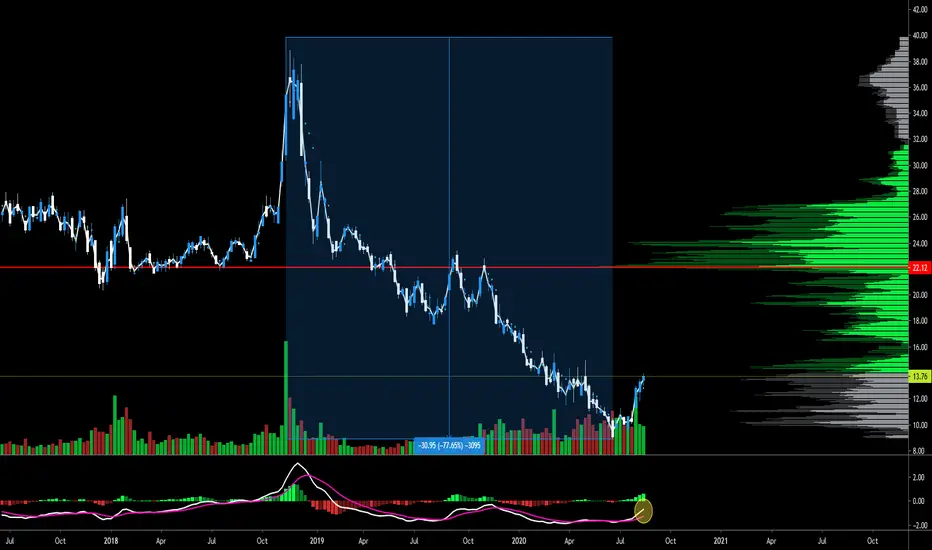
UNG - Got Gas?
This two year chat shows a 77% drop in Nat Gas from the high to the bottom - looks like the worst is over.
Use the red line as an ambitious target which the 2 year average price.
If you discount 25% for the 2020 Experience still looks like there is some up side - $17 - $18
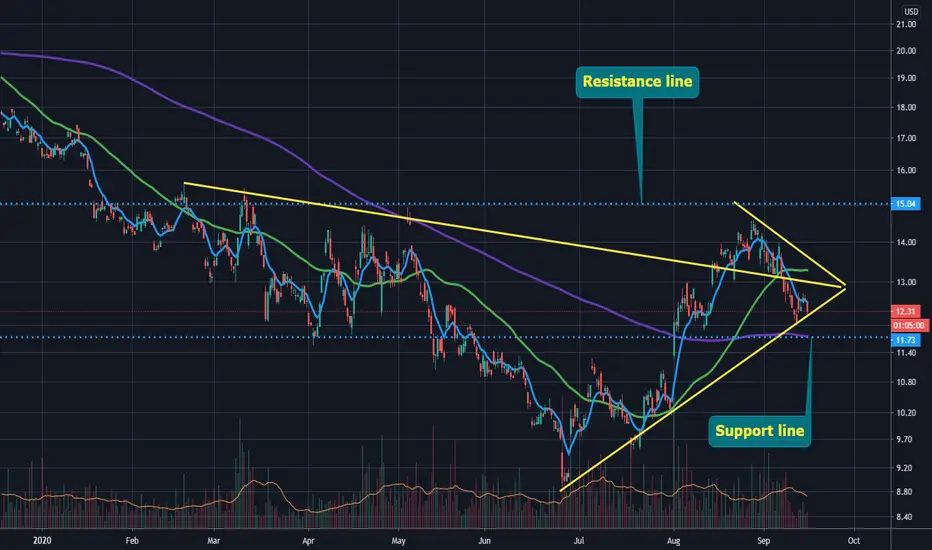
Yeah, its an unfortunate confluence nowAn overhead resistance and a tweaked channel have colluded to make a an area that looks like a strong short for natural gas. The bars have changed colour and I think it could be a nice short play. I have not year decided how far this will go, please remember I have previously stated we are possibly in a bear flag. Also, don't misunderstand - I am bullish on natural gas long term, but since its breakout from its huge decline it could be time for a breather!
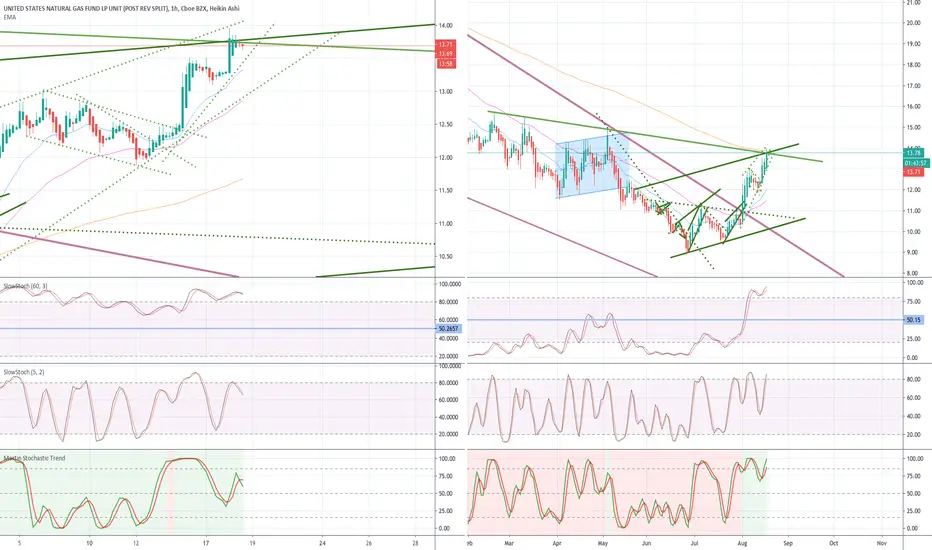
Natural Gas: Possible baby-bull flag inside a larger bear flagI'm very bullish on Natural Gas over the long-term. We have had a confirmed breakout bullishly from a descending triangle going back years, but now that we have had our early nascent move it might be time to pull back a bit. Of course all is invalidated if it breaks through the overhead support, but for now I'm seeing a small move up with a subsequent larger move down.
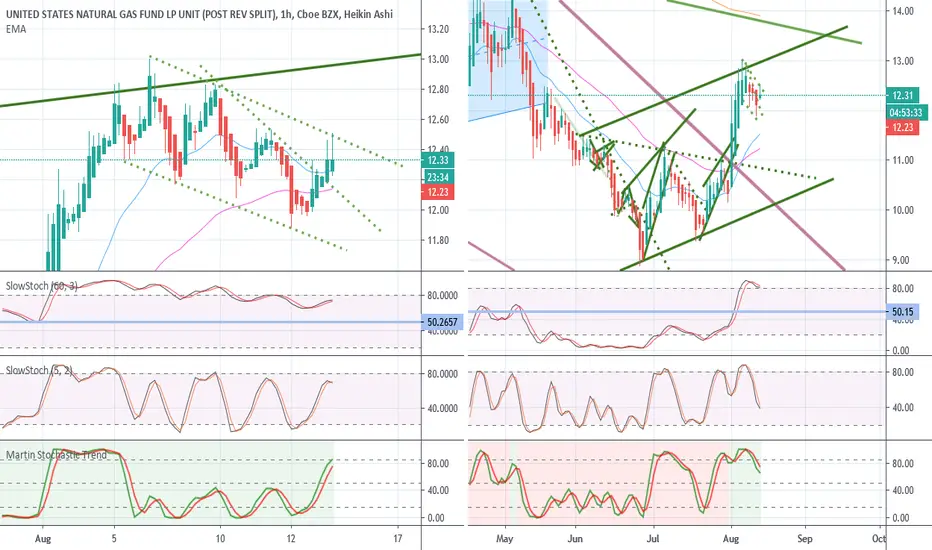
The Natural Gas Bull Market May Have BegunUNG had a spectatcular move the other day (once again I was on the wrong side of the trade but I the ship has been corrected). Rather than buying shorts after a rise in UNG, it appears like a bull market is starting so dips must be bought. The massive descending triangle going back to 2017 seems to have been broken with an open and close on the daily charts. Worringly though there appears to be a small bear flag on this breakout, so don't get disheartened. So long as we stay above the maroon line we should be all right.

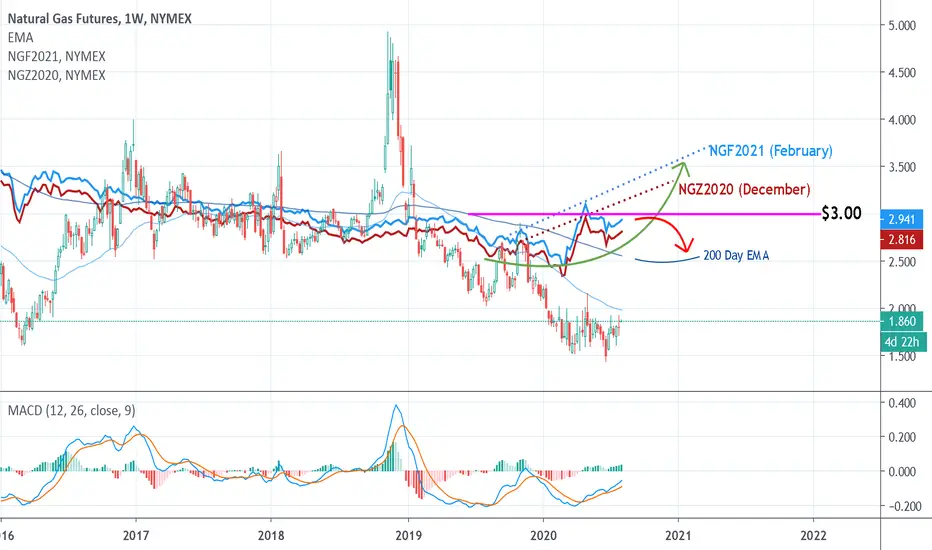
Natural Gas - Winter ContractsWinter contracts for Natural Gas are already trading near the pivotal $3.00 level.
If Winter this year turns out to be average prices will likely sell off towards $2.50 (the 200 Day EMA).
However, if production continues to fall and Winter is cold enough, prices can break above $3.00 and complete the parabolic move that is forming.
If the latter happens, I see prices for December(Z) contracts topping out around $3.10 - $3.30
February(F) I see topping out around $3.40 - $3.60
I'm looking for a buying opportunity on the December contract and praying for a cold November to sell it in.

Natural Gas - Winter 2020-21 UpdateOn June 3rd I posted my strategy for trading Natural Gas this coming Winter (linked below). As prices slowly drift lower, it looks like traders are beginning to accumulate long positions.
I've opened a long position on the December(Z) E-mini contract and might add 1 or 2 more over the next couple months with the sell target up around $3.30ish. Will see how it plays out.
I chose the December contract because the volume on the E-mini is extremely thin on the January and February contracts.
+1 @ $2.76

Natural Gas - Bought the Dip AgainTraders are done selling for now and will be looking to test the $2 level next in anticipation of August heating demand. A bullish pennant is forming and should break out after price clears above the 50 day EMA.
Moving forward, buying the dip is the play as we head towards Winter.
Opened a long position on the September(U) contract @ $1.795

Natural Gas - Bought the DipNatural Gas prices got hammered this past week. There's too much supply and not enough demand however, prices are near the bottom of the trading range and Summer heat should give prices a boost soon.
It's also worth mentioning that the Dollar DXY is trending lower and which is bullish for all commodities.
Prices are breaking out of a downtrend so I've opened a long position on the September(U) contract.
It's nearing the end of the month and the August(Q) contract will expire soon.
+1 @ $1.725 ($QGU20)
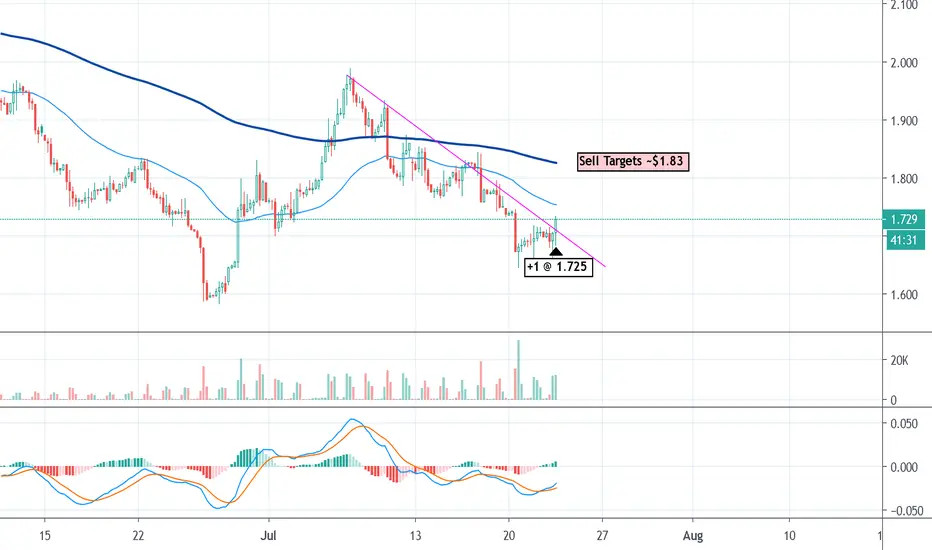
Natural Gas - Buy the HeatHot weather will likely boost Natural Gas prices in the near term so I opened a long position after price broke above $1.80 again.
$QG - E-mini Natural Gas Futures
+1 @ $1.815
Sell Limit -1 @ $1.94
Additionally, the MACD is showing bullish momentum on the 4hr chart and prices are being supported by the 50 and 200 EMA. If price clears $1.83 I see the momentum taking it up to $1.94 at the very least and $2.04 at the most. Should prices fall I might buy more and average down my cost basis since I don't think prices will stay down for very long under these conditions.
weather.com


The long term outlook holds - The breakoutOne week after our initial analysis NG is already recovering! If you went long last week move your SL to cost, unless NG goes above 2 and holds, we remain in the bearish channel and could test the low one more time. Long term outlook remains very bullish.

UNG: NG Natural Gas Declining Through Summer on Low DemandNG Natural Gas August futures contract has been declining on cancelled LNG shipments and low national demand. US supply keeps steady outpacing demand. US demand started improving on June 21st due to reopening of NY-NJ-PA economies. However, Texas extended its lockdowns, counteracting positive effect of the East Coast. Seasonal heat is high. But with 40-50 August LNG shipments cancelled, the market may remain in oversupplied state for months to come.
August 24th may be a potential turning point for natural gas. Prices are likely to continue decline under current oversupplied conditions. Analysts see target support at $1.25, 1995 low, and then at $1.00, all-time low. Resistance is seen at $1.52, and $1.60 levels.
Technicals: Daily chart is pointing to a neat-term bottom with potential upward move within declining channel. NG rolled into August contract, which was trading higher than July contract, which could explain a Friday pop. There is a possibility for a near-term price improvement to $1.65- $1.75 level (tentative), between July 1st and July 17th, with continuing decline after mid July.

Natural Gas - Summer 2020As of now, expecting lots of chop within a range between $1.50 and $1.83 all Summer.
Supply is abundant and demand is slow however, bankruptcies from 25-year low prices will soon take chunks out of production and demand may have bottomed already. Hot weather forecasts in high demand states (the South and Northeast) should also pop prices. Risk to the downside is if New York starts locking down again, signalling more demand loss on the way.
Trade strategy:
Buy near the bottom of the range and sell near the top and/or on bounces from the 200 (4hr) EMA
If there is a daily close below $1.50 or some kind of big push below that level I'll close all positions.
Active trades ($QG Natural Gas E-Micro Futures):
+1 @ $1.53

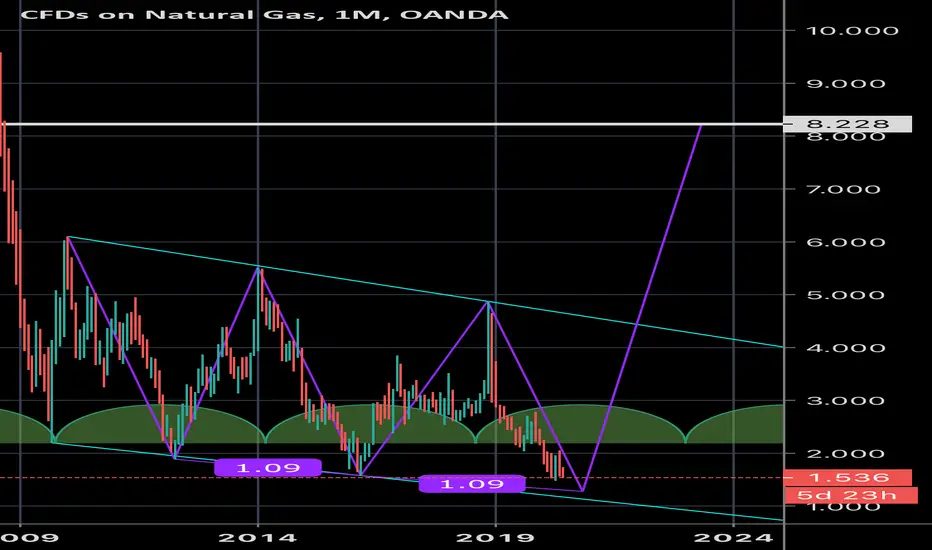
NG final leg for 5 yearsNG is about to take the final leg down to complete cycle 3 down wave. Three Drivers pattern should be complete with that leg and the next up move will push for the breakout of the 11-years channel.

NG: UGAZ: Natural Gas Consolidating Lower. Demand Improving.NG Natural Gas July futures contract continues declining on recent lower demand. Fundamentals are still bearish: low LNG exports, 4 Bcd vs 9 Bcd in the winter, and cooler weather over North East. The temperature is expected go higher on June 25-28, per NatGasWeather. With economy reopening on June 20-21, EIA weekly report may turn bullish in the 1st week of July.
The chart is oversold; buyers are coming in at $1.60 level. Last week build was 93 bcf. A build below 90 bcf would be a bullish sign. A short-covering rally may happen soon in anticipation of improving demand.
Lower prices are still possible, if LNG exports do not improve, or weather does not prove to be hot enough. Yet, reopening of the economy should boost demand significantly moving into July.
