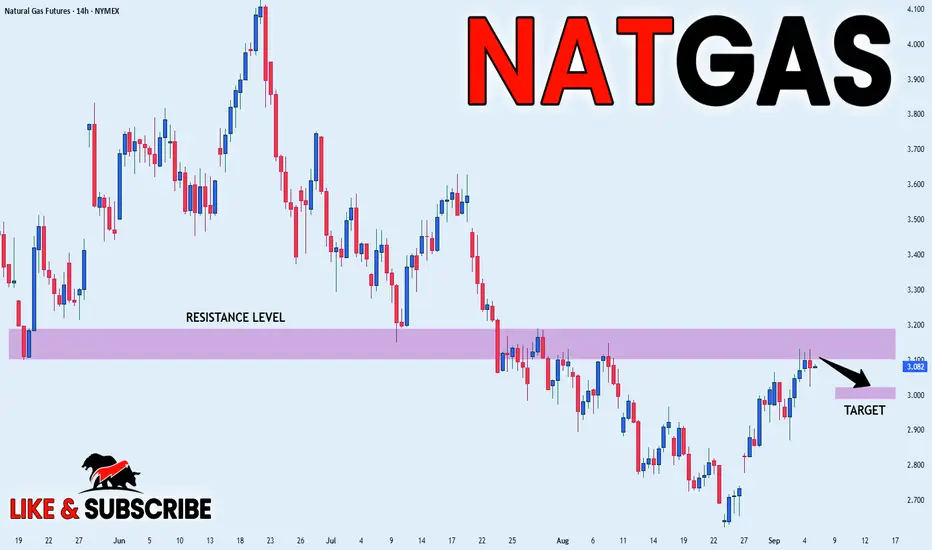
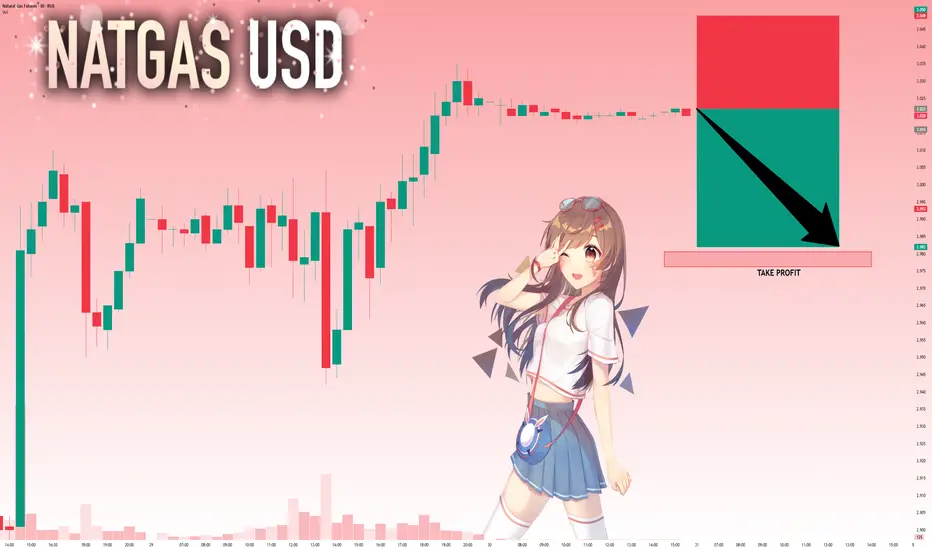
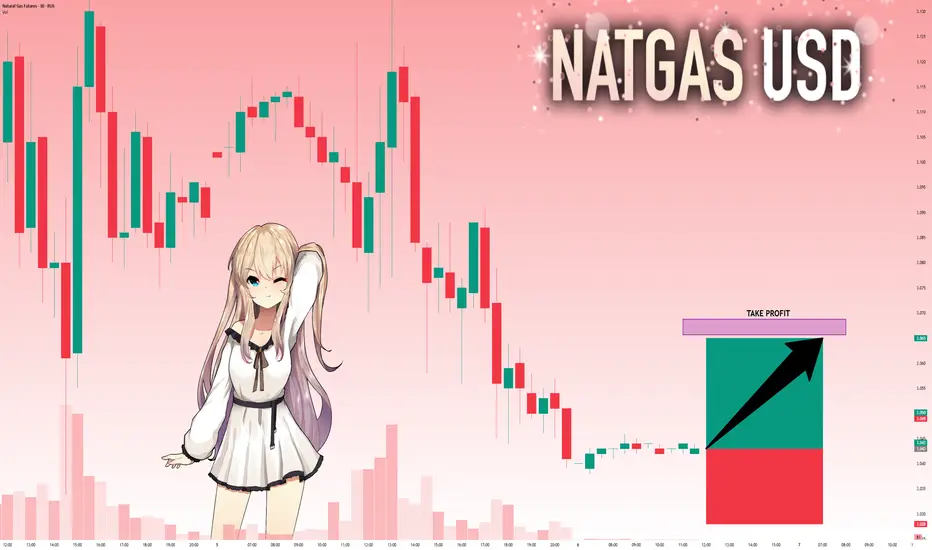
NATGAS WILL FALL|SHORT|
✅NATGAS has been growing recently
And the Gas seems locally overbought
So as the pair is approaching
A horizontal resistance of 3.136$
Price decline is to be expected
SHORT🔥
✅Like and subscribe to never miss a new idea!✅
Contract highlights
Related commodities
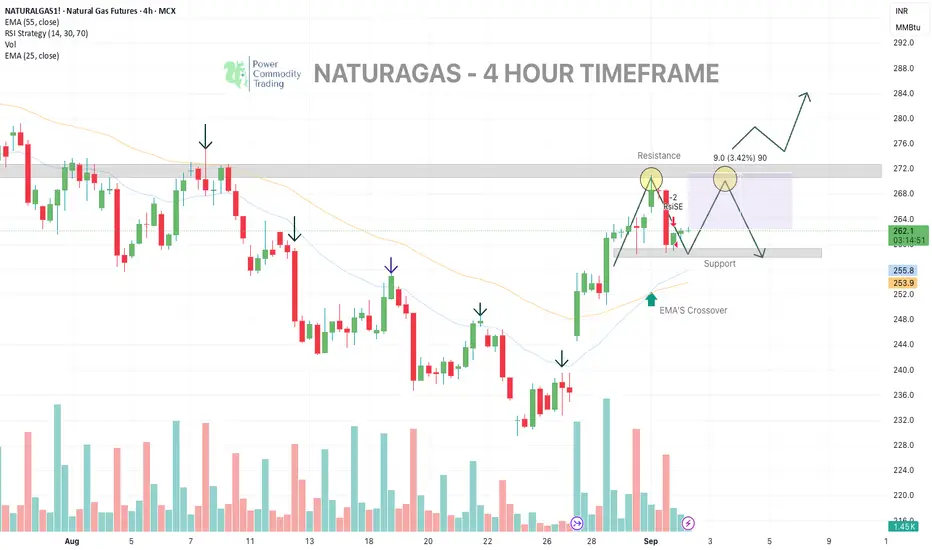
NATURALGAS : A DOUBLE - TOP PATTERN
We are tracking a possible double-top pattern here (4 hr timeframe)
Bearish Case: If price fails to sustain above resistance and later breaks support (252–256) → confirmation of double-top → downtrend likely to follow.
Entry 263
Target 268 - 271
Invalidation: sustains above resistance, the double
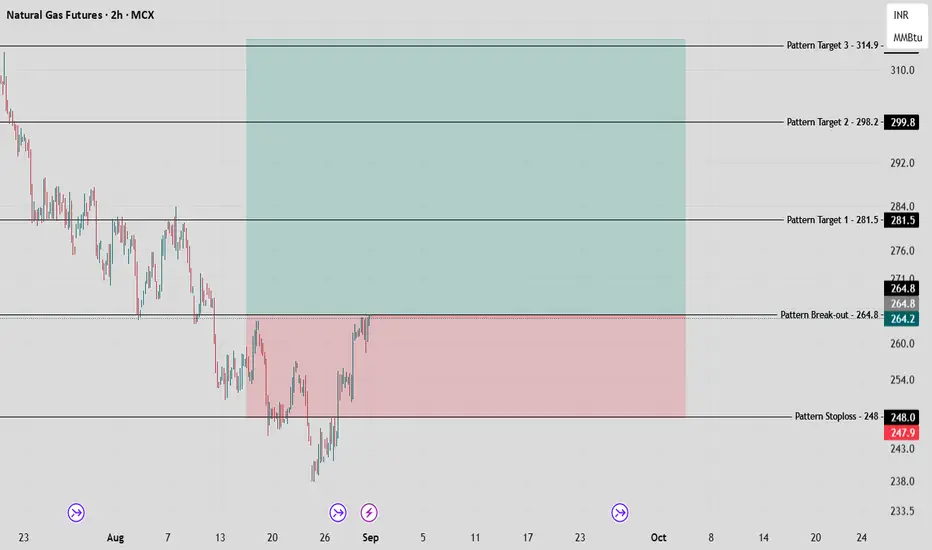
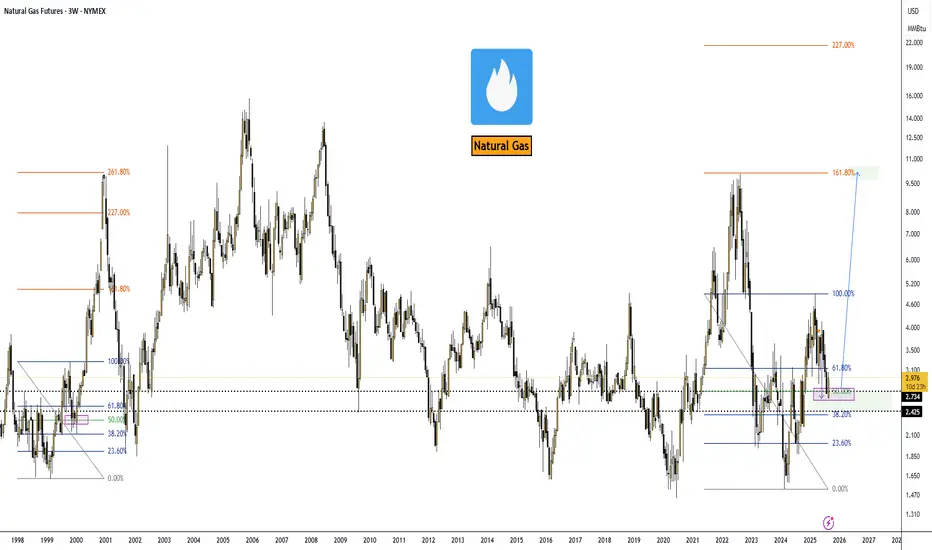
Natural Gas Positional Giant Lap Awaited in Coming Days! MCX:NATURALGAS1! Natural Gas Futures have printed a strong bullish engulfing pattern on the weekly chart, emerging after a prolonged downtrend—a classic sign that momentum may be shifting in favor of the bulls.
Pattern & Setup Analysis
The appearance of a large green candle fully engulfing the pre
NATGAS My Opinion! SELL!
My dear subscribers,
My technical analysis for NATGAS is below:
The price is coiling around a solid key level - 3.016
Bias - Bearish
Technical Indicators: Pivot Points Low anticipates a potential price reversal.
Super trend shows a clear sell, giving a perfect indicators' convergence.
Goal - 2
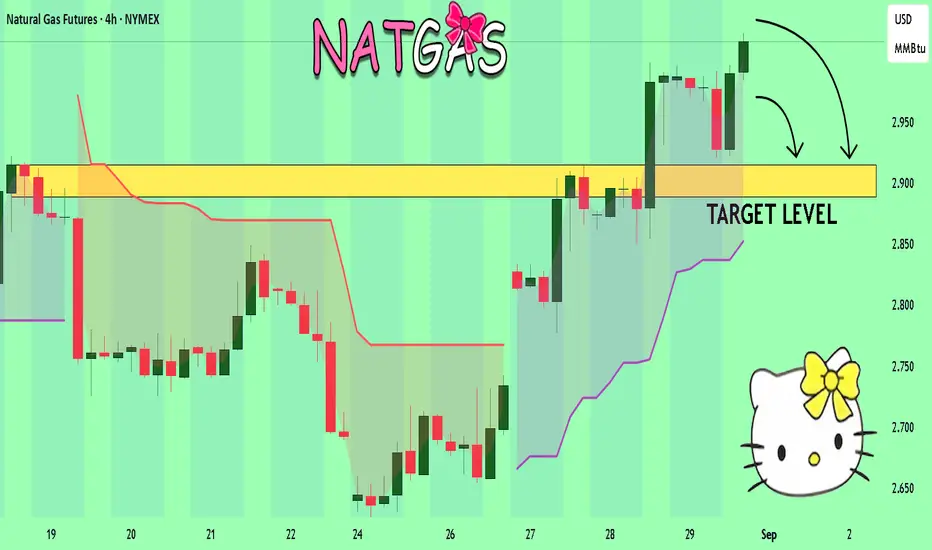
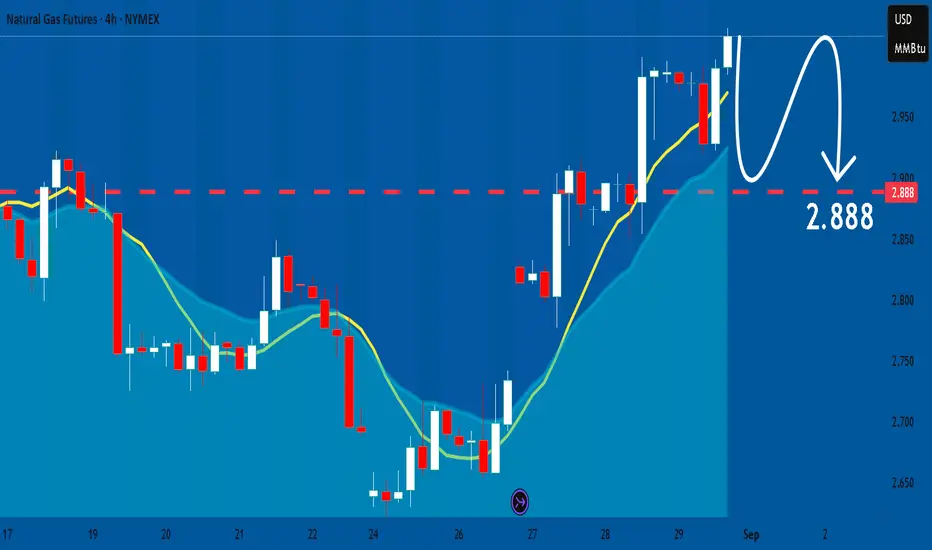
Natural Gas Market Outlook — September 01, 2025.VANTAGE:NG #NaturalGas #NatGas (NYMEX:NG1!) 🔵 Natural Gas Market Outlook — September 01, 2025.
Alright, here’s the skinny on NatGas. Back on April 28, 2025, I was calling for a dip into the $2.74 zone—and guess what? We tagged it right on schedule.
Now the game flips: I’m hunting long entries wi
NATGAS: Bearish Forecast & Bearish Scenario
It is essential that we apply multitimeframe technical analysis and there is no better example of why that is the case than the current NATGAS chart which, if analyzed properly, clearly points in the downward direction.
Disclosure: I am part of Trade Nation's Influencer program and receive a mon
NG1!: Move Down Expected! Short!
My dear friends,
Today we will analyse NG1! together☺️
The market is at an inflection zone and price has now reached an area around 3.022 where previous reversals or breakouts have occurred.And a price reaction that we are seeing on multiple timeframes here could signal the next move down so
NATGAS Sellers In Panic! BUY!
My dear subscribers,
My technical analysis for NATGAS is below:
The price is coiling around a solid key level - 3.026
Bias - Bullish
Technical Indicators: Pivot Points Low anticipates a potential price reversal.
Super trend shows a clear buy, giving a perfect indicators' convergence.
Goal - 3.
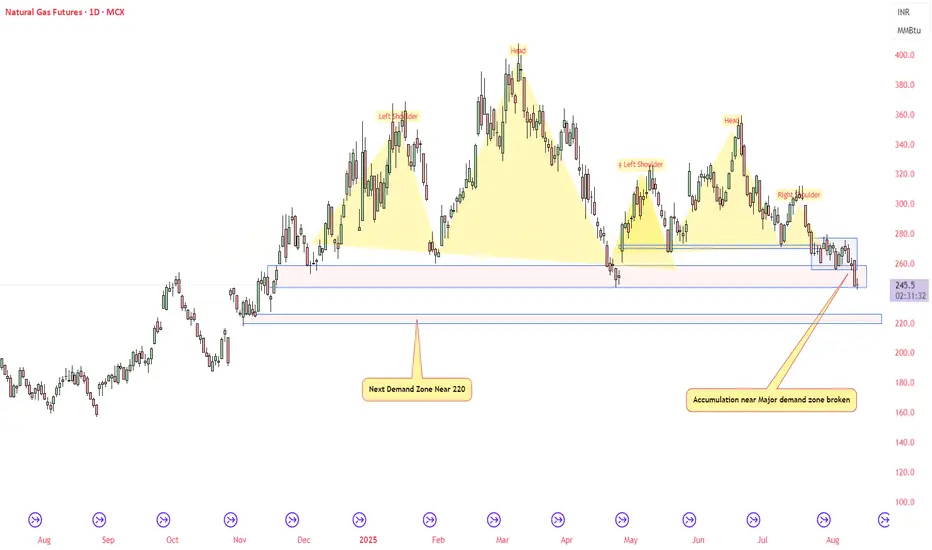
NATURAL GAS - Head and Shoulder PatternNatural Gas being in slow demand may see more bearishness near 220, fresh accumulation near major demand zone broken.
Do your own study before taking any trades
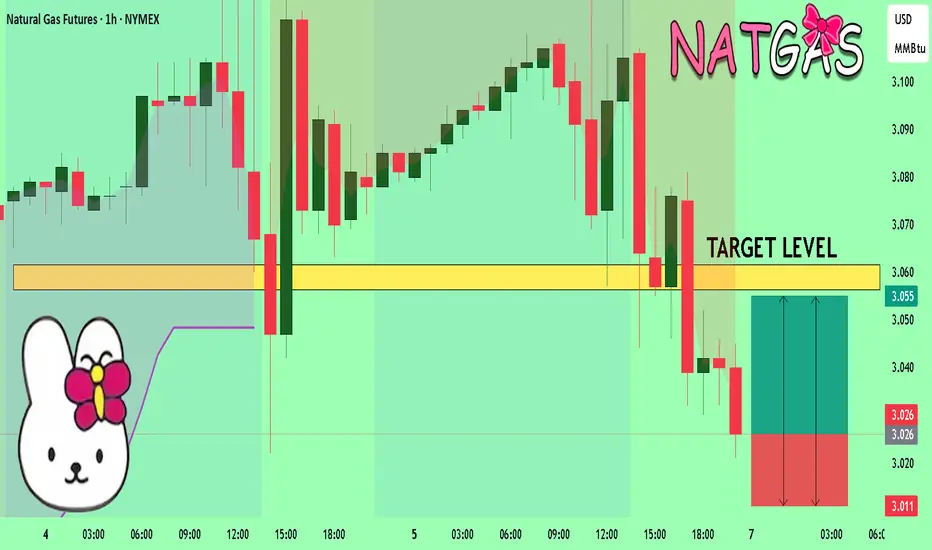
NG1!: Next Move Is Up! Long!
My dear friends,
Today we will analyse NG1! together☺️
The price is near a wide key level
and the pair is approaching a significant decision level of 3.043 Therefore, a strong bullish reaction here could determine the next move up.We will watch for a confirmation candle, and then target the n
See all ideas
A representation of what an asset is worth today and what the market thinks it will be worth in the future.
Displays a symbol's price movements over previous years to identify recurring trends.
Frequently Asked Questions
The nearest expiration date for Henry Hub Natural Gas Futures (Jul 2020) is Jun 26, 2020.
Traders prefer to sell futures contracts when they've already made money on the investment, but still have plenty of time left before the expiration date. Thus, many consider it a good option to sell Henry Hub Natural Gas Futures (Jul 2020) before Jun 26, 2020.