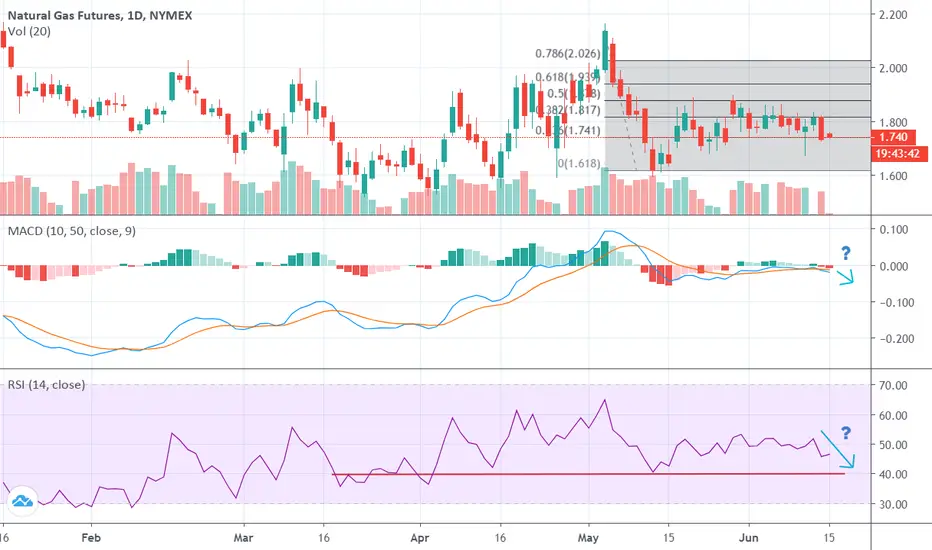
NG: Natural Gas Further ConsolidationNatural Gas NG July futures bounced last week on warmer weather and production cuts. On Friday we saw a pullback, as weather forecasts lost some CDDs (cooling degree days). UNG fund started August contract roll on June 12 -17.
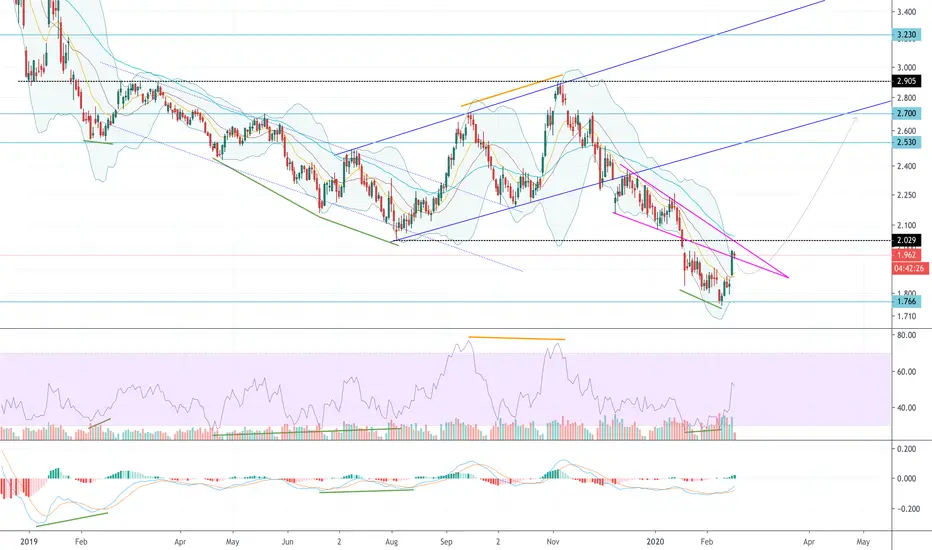
Technicals: Daily and 4 Hr chart are pointing toward lower prices; 1 Hr chart is forming a bottom. We may have a short-term bounce from lower levels, but overall direction is pointing toward lower prices, or consolidation.
Fundamentals: demand/supply balance remains bearish in the near-term; prolonged heat is required to produce a rally in prices, although the number of rigs has declined by 7. Second half of June was expected to be hotter per last week's forecast, but on Friday, weather pattern turned cooler, with lower demand for cooling. Until the next heat wave emerges, we may be facing lower prices.
Crude oil prices are declining due to high inventories build and worries about slow economic recovery, adding to the bearish picture.
On the positive note, economy is reopening in higher consumption states, NY, NJ, and PA on June 20th. Weekly EIA report capturing this period may show higher consumption two weeks from now. Until then, a strong prolonged heat wave is required to change current bearish price pattern.
UNG
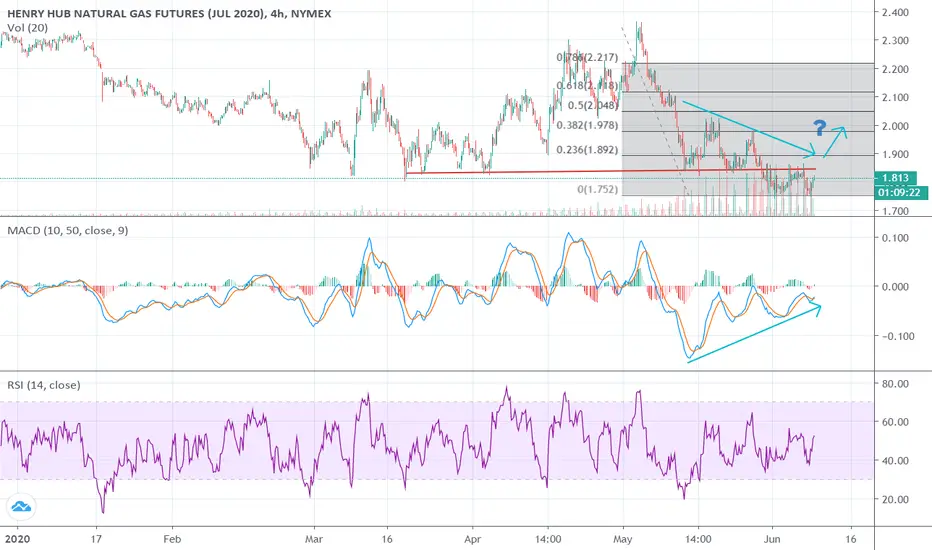
UGAZ: NG Demand Rising. Positive Divergence?Natural gas demand is rising due to electric power sector demand increase. Total U.S. consumption of natural gas rose by 3.9% compared with the previous report week. Natural gas consumed for power generation climbed by 10.1% week over week. In the residential and commercial sectors, consumption declined by 5.9%. Industrial sector consumption decreased by 0.3% week over week. Natural gas exports to Mexico increased 4.8%. (Data from EIA report, last week).
Technicals are showing a positive divergence between momentum and price; MACD is showing higher bottoms (coiling) while NG prices continue to consolidate. A potential for a break to the upside? Waiting for Thursday EIA report.
This week residential demand is continuing to rise because of hot weather. Industrial sector is also picking up due to reopening. Hurricane reduced production by 1 bcf, although produced delays with LNG exports. Fundamentals are turning bullish, although we are still oversupplied. May need another 2 weeks of growing demand to overcome high storage build.
UNG: ready to CALLI bought CALL on Friday market close,
Plan to hold it for two weeks, see what will happen in Jun


Time to go long NATGASloading UGAZ is also a good idea. this is not falling below 1.5 now. if it has to then it would have in last 2 months.

May 10 Market Update | Technical, Fundamental, NewsDescription:
A simplified analysis for the week ahead.
Points of Interest:
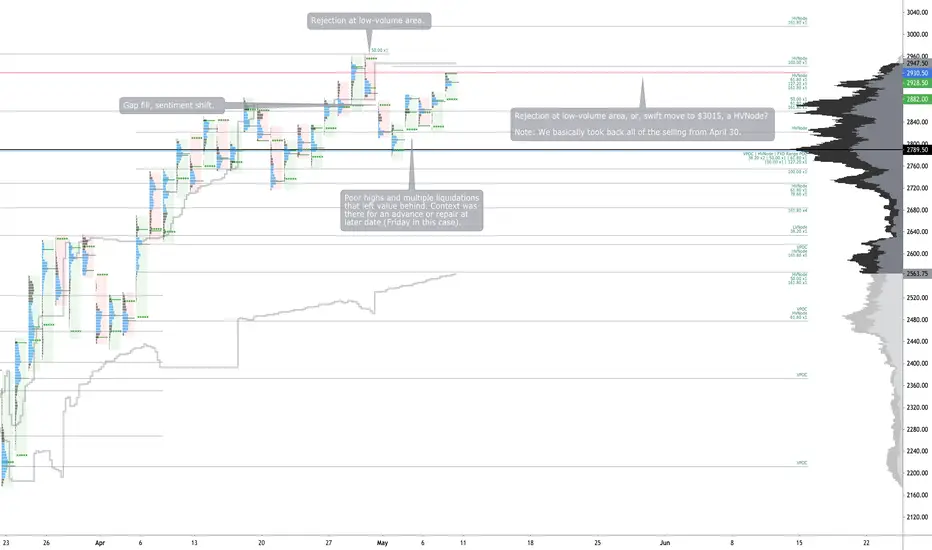
$2965 Low-Volume Area; Targets $2940, $3015; VWAP Feb ‘20 High, Mar ‘20 Low, and Dec ‘18 Low.
Technical:
Broad market indices, such as the Nasdaq (/NQ), have shown relative strength, trending higher and experiencing muted liquidations. The Russell (/RTY) took back the Volume Weighted Average Price (VWAP) anchored from the Feb ‘20 high, which also corresponds to its 50% fibonacci retracement level.
Above current prices is a low-volume area which developed when participants had solid downside directional conviction. The short term strategy is to fade (short resistance, long support). When you trade into an area of low-volume, then sentiment (directional conviction) has changed and movement is swift. In case of the S&P 500, acceptance above Friday’s late-day spike may point to the subsequent penetration of the low-volume area and swift movement to $3015, the other end of that area.
Spending minimal time above Friday’s spike base and high would point to rotation back into the high volume area we are attempting to leave. These high-volume areas are sticky, since they develop when prices slow to satisfy two-sided, rotational trade.
Last week I said that if the market reverses and overtakes the initiative activity that created the gap, then sentiment has changed. Well, we reversed.
Despite the market moving higher on Tuesday, participants did not have enough conviction to follow through. We left behind a thick area of value and an intraday poor high before selling-off on the Fed Clarida doom and gloom news. Excess was established lower, during the overnight session. The type of selling that occured on Tuesday was not accompanied by new money, left value behind, and offered a good opportunity to sell puts or establish some low-risk long positions.
On Wednesday, we sold off again, leaving mechanical looking highs. When the following day retraced that selling, the context was there for repair of Tuesday’s high.
All this put together, the most important note to be made is Friday’s continuation higher on terrible economic news. If the fundamental context is crap and we go higher, I’m not going to be bearish.
In case of upside, targets include $2940 and $3015. On a continuation lower, targets include $2860, $2820, and $2786, the convergence of significant references.
Scroll to bottom of document for non-profile charts.
Fundamental:
Key Events: CPI; Initial Claims; Retail Sales; Industrial Production; UoM Confidence; Inventories; Producer Prices; Import Prices; Earnings.
Moody’s projects retail and apparel spec grade default rate to surge. bit.ly
European automakers restart production. Demand pickup remains questionable. bit.ly
Shell dividend cut good for credit, but highlights downturn severity. bit.ly
ISM non-manufacturing index falls as prices rise on increased shipping costs. bit.ly
Market priced in negative U.S. interest rates. reut.rs
Second phase of reopening to see turnover and employment impact. reut.rs
China is not complying with the Phase 1 trade deal. bit.ly
Borrowing plummeted as consumers pulled back credit card use. bit.ly
Mortgage forbearance requests plateau. bit.ly
Virus shock to reduce some banks’ capital, increase credit vulnerability. bit.ly
Industrial Metals Price Index suggests downturn will lack GFC severity. bit.ly
Mortgage applications from homebuyers show an improving trend. bit.ly
Treasury to issuer longer-dated debt to finance growing deficit. on.mktw.net
Sentiment: 23.7% Bullish, 23.7% Neutral, 52.7% Bearish as of 5/9/2020. bit.ly
Gamma Exposure: (Trending Higher) 3,754,598,011 as of 5/9/2020. bit.ly
Dark Pool Index: (Trending Lower) 44.1% as of 5/9/2020. bit.ly
Product Analysis:
/ES: AMEX:SPY TVC:SPX
/NQ: NASDAQ:QQQ TVC:NDX
/RTY: AMEX:IWM TVC:RUT
/YM: AMEX:DIA DJCFD:DJI
$NYA: TVC:NYA
/GC: AMEX:GLD
/CL: AMEX:USO AMEX:DBO AMEX:USL
/NG: AMEX:UNG
/ZB: NASDAQ:TLT
Disclaimer:
This is a page where I look to share knowledge and keep track of trades. If questions, concerns, or suggestions, feel free to comment. I think everyone can improve, especially me.
In no way should this post be construed as investment advice.


#natgas: June takes over as prompt $UNG @enelyst_$2.00 remains resistance. Will it break higher as the forward curve shows contango?

May expires in the heart of its trading rangeNatural gas prices finished higher today after Monday’s huge intraday surge. The expiring May contract saw very light trading action, but peaked at $1.92 during the morning. Midday selling pressure as traders finalized positions brought the prompt month to near $1.80 by the afternoon settle. The much more heavily-traded June contract crossed the $2.00 level early on, then drifted lower though still finished ahead.

April 26 Market Update | Technical, Fundamental, NewsDescription:
An analysis for the week ahead.
Points of Interest:
2730-2845 Balance Zone; Targets 2930, 2630; CBOE:VIX at 36.
Technical:
Nasdaq leading to the upside, with a complete retracement of Thursday’s news-driven sell-off.
Market is balancing, leveraging time to correct, rather than price. Composite profile (2/19-4/24) POC at 50% retracement. Additionally, YTD VWAP lies nearby, a clue to why prices are so rotational here. Read more about VWAP here: bit.ly
Despite terrible news, the market held up fairly well. On 4/17, /ES met it’s measured move, piercing into an area of low volume which served as resistance. Market quickly liquidated to the 2730 area and was not met with new selling. Instead, in subsequent trading, prices and value shifted higher, above the 50% retracement.
Aside from remaining in balance, the market could extend directionally, or extend and return to balance quickly. Taking out 2730, downside target at 2630, a low volume area that could serve as support. Breaking above 2845, also an area of low volume on the composite profile, target 2930.
Scroll to bottom of document for non-profile charts.
Fundamental:
Key Events: Central Bank Meetings; Initial Claims, Earnings; GDP; Home Sales; PCE; Consumer Confidence; Personal Income; Construction Spending; Vehicle Sales; ISM Manufacturing.
Who’s Winning: Remote Work (e.g., Zoom, Slack, Microsoft, Facebook), Cloud (e.g., Amazon AWS, Microsoft Azure), Telemedicine (bit.ly). Tickers: NASDAQ:ZM , NYSE:WORK , NASDAQ:MSFT , NASDAQ:AMZN
Who’s Losing: Software (e.g., Google Chrome), Video Games (e.g., Sony), Hardware, Camera (e.g., GoPro), Manufacturing (e.g., Boeing, Ford, GM, U.S. Steel), and more (bit.ly). TICKERS: NYSE:SNE , NASDAQ:GPRO , NYSE:F , NYSE:GM , NYSE:X
Gamma Trap: Despite terrible news, major market indices ended the week practically unchanged. This comes as SPX 2,800 emerges as the neutral gamma zone. A close above $2813 SPX would “push dealer gamma in the green, creating a feedback loop whereby higher prices result in even higher prices as dealers are forced to chase the market higher” (bit.ly). TICKERS: AMEX:SPY , TVC:SPX
The Bear’s Case: “In view of how the equity market was recently up by 25.6% from its March 23 low, it should be mentioned that during the equity market’s long trek to its March 2009 trough, at one point (on January 6, 2009 to be exact) the equity market was up by an even greater 26.3% from its then low of November 20, 2008. As it turned out, the U.S, equity market sank by 27.3% from January 6, 2009’s misleading high to March 9, 2009’s bottom. Thus, even a 26% jump by the equity market from a bottom does not necessarily obviate the impending formation of an even lower trough.” Read More Here: bit.ly
The Bull’s Case: "The market is loudly saying the Fed Bazooka worked to turn the tide, and risk assets are going higher.” (bit.ly). "If this bear market was much shorter than other , it’s because the speed and magnitude of Fed actions." "Negative data is the reality around market bottoms. If this rally continues, the negative data will become less bad on the margin over the next several months. In 2009, the market started rallying in March and the non-farm payrolls report didn’t turn positive until November." "If the Fed has successfully started to reflate the economy as many assets suggest, the bond market will need to confirm this trend." "If bond yields don’t start moving higher in the next 4 weeks, this would be a major signal that the reflation trade is not working."
Crisis Averted: In New York, the risk of hospital overflowings was never realized and states are showing a genuine interest in getting back to work. "The scenes in Michigan and elsewhere show genuine hunger to resume working." "Wuhan gives us clear evidence that things can reopen within 90 days. Again, this is much better than the worst scenarios." Read More Here: bit.ly
Oil: Dislocations within physical markets remain, a negative for short-term price volatility and the spread between WTI and Brent. Adding, “US crude prices below $30/barrel (bbl) in the second quarter of 2020, and oil prices beneath the cash cost of production will lead US oil and gas producers to keep announcing deep cuts in capital spending. Such spending cuts will accelerate the decline in US oil production in 2020 and into 2021,” a downside for oil prices in 2020, even with the expected decline in supply (bit.ly). Moody’s Energy Downgrades: bit.ly Citi on the ‘New World of Petroleum’: citi.us Short puts in /CL worth the risk? Check out the statistics here: bit.ly What Oil ETFs To Invest In (HINT: Avoid $USO): bit.ly TICKERS: $CL1!, $DBO, $USL
/CL To /GC: “Realistically, a dramatic breakdown in the gold market (which might actually present as a super-spike) can’t be viewed as highly likely. But then again, an infectious disease epidemic wasn’t included in most 2020 pricing models either, nor was negative-priced crude. While it may not seem likely, one can see how a dislocation in the gold market, one starving for physical gold, could result in a strong, unexpected rally—the exact opposite of what has occurred in a flooded crude oil market.” Read more here: bit.ly TICKER: $GC1!, $GLD
Steel: “The U.S. steel industry has fallen into its most severe downturn since the 2008 financial crisis. United States Steel Corp., ArcelorMittal and other steelmakers are ratcheting back output and shedding workers, anticipating that orders and prices will fall further” (bit.ly).
Trade: “There were high hopes that China's commitment to $200 billion of increased spending on U.S. agriculture, energy, manufacturing and services as part of the ‘phase one’ trade deal would help make farmers whole. But as the virus outbreak rattled Chinese demand, those planned purchases evaporated” (bit.ly).
Treasury Run: Expectation for a sustained rise in Treasuries (mostly longer-dated maturities) remains as economic rebound expectations become more delayed (bit.ly).
Yields: “An unfolding global recession will rein in Treasury bond yields. As long as the global economy operates below trend, the 10-year Treasury yield may not remain above 1.25% for long. Until COVID-19 risks fade, substantially wider credit spreads are possible” (bit.ly).
Bond Credit: COVID-19 to strain sovereign and bank credit quality in Europe, a negative for covered bond credit. On the other hand, “covered bonds will continue to benefit from systemic support amid the coronavirus disruptions - as occurred during previous crises - which will help support overall credit quality” (bit.ly).
Earnings: Boeing, Apple, Alphabet, Facebook, Exxon, Chevron to post slowdowns or losses in certain categories. Microsoft, Spotify, Qualcomm and Amazon earnings likely to show gains in certain categories. Read More Here: tmsnrt.rs TICKERS: NYSE:BA , NASDAQ:AAPL , NASDAQ:GOOGL , NASDAQ:FB , NYSE:XOM , NYSE:CVX
Unemployment: True number of people unemployed between 32-70 million people (i.e., 20-45% unemployment rate), according to Axios (bit.ly).
Liquidity: Desire to assure adequate liquidity during has prompted a temporary surge by IG bond offerings (bit.ly). Typically, alongside a rise in corporate bond issuance comes the refinancing of “outstanding short-term debt, such as commercial paper, as long-term fixed-rate bonds in order to eliminate the risk of not being able to roll-over very short-dated credit market instruments. Once the recession subsides and the return of profits growth is visible, the imperative to buttress liquidity fades and IG bond issuance sinks as was the case during the 12-months-ended June 2010.”
Rescue Package: House approved a $480 billion coronavirus rescue package that provides aid to SMEs and hospitals. Additionally, the bill will provide a $320 billion infusion for the Paycheck Protection Program (PPP) which ran out of money last week. Read More Here: politi.co Check Out Moody’s PPP Breakdown Here: bit.ly
Hubei: The epicentre of the coronavirus outbreak had its economy shrink by 40%, the largest drop for any province since the founding of the People’s Republic of China in 1949.
Consumer Sentiment: “Morning Consult finds respondents are showing increasing optimism about the future, as the number of people who say they expect to be worse off in a year has consistently declined,” since sentiment hit a low April 7 (bit.ly).
Money Market Flows: “A record $4.65 trillion is now held in money market funds. That's around $700 billion more than the peak level seen during the 2007–2009 global financial crisis” (bit.ly).
Farming: U.S. family farmers filed 595 bankruptcies in 2019, up from 498 filings in 2018 (reut.rs). Adding, the USDA announced a $19B support program for farmers and ranchers, helping soften the blow to demand for many agricultural commodities (bit.ly). Moreover, the two prior pieces of news come alongside the closing of major meat plants across the United States, which may net higher meat prices in the long-term (bit.ly). Note: “The Farm Credit System is also strongly capitalized, a credit positive, in the event that its credit costs rise materially” (bit.ly). TICKERS: AMEX:DBA
Startup Funding: Crunchbase projects $34.5 billion was invested in North American startups in Q1 2020, up 2% year over year. The increase is attributable to late-stage venture funding. Read Here: bit.ly
Sentiment: 24.9% Bullish, 25.1% Neutral, 50.0% Bearish as of 4/25/2020 (bit.ly).
Gamma Exposure: (Trending Lower) 1,264,910,712 as of 4/25/2020 (bit.ly).
Dark Pool Index: (Trending Lower) 44% as of 4/25/2020 (bit.ly).
Index Analysis:
$SPX: TVC:SPX
$NDX: TVC:NDX
$RUT: TVC:RUT
$DJI: TVC:DJI
$NYA: TVC:NYA
$UKX: TVC:UKX
$NI225: TVC:NI225
$HSI: TVC:HSI
Futures Analysis:
/GC: AMEX:GLD
/CL: AMEX:USO AMEX:DBO NASDAQ:USLV
/NG: AMEX:UNG
/ZB: NASDAQ:TLT
Disclaimer:
This is a page where I look to share knowledge and keep track of trades. If questions, concerns, or suggestions, feel free to comment. I think everyone can improve, especially me.
In no way should this post be construed as investment advice.

the coming wave$ung $ugaz $dgaz $boil $kold $unl $gaz
I'm gearing up for the next cycle.I wouldn't be surprised to see a deeper flush. Be careful with leveraged ETF's even though they appear cheap. We don't know how low this can go..take a look at what happened to oil etf's as oil went to zero and below. what strange times we live in.
NG: Invest one mini NG contract for a 30 minutes trendRecord my Natural Gas future contract investment.
(Arp/17/2020) Initial : one mini NG May contract around $400, still have $1000 cash


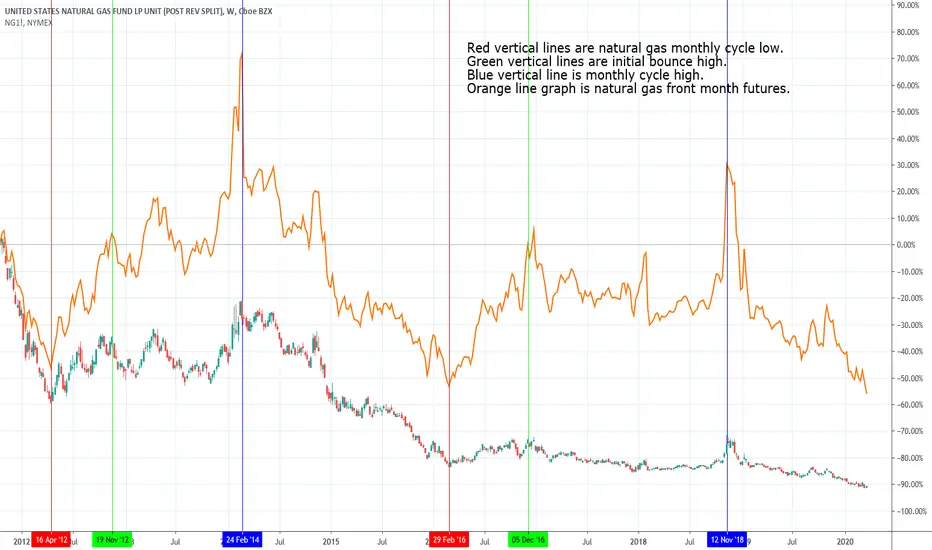
UNG Performance During 2012 and 2016 RalliesThis is a continuation of my 2020 bull rally theory, finding the best way of capitalizing on the potential opportunity in front of us is the next step.
UNG follows the price of natural gas fairly well, UNG does experience rolling decay when futures are in contago. Contago is typical for natural gas futures. Because of the rolling decay holding UNG long term is not a good strategy. While not nearly as bad as UGAZ it still reduces possible gains over the long term.
UNG is predictable and a good option for novice investors looking to get into natural gas trading.
UNG would be a good hold for the daily cycle and a ok hold for the weekly cycle. Weekly cycle would be positions attempting to take advantage of the seasonal swings.
UNG options may represent one of the greatest opportunities, due to the risk of options having a predictable ETF like UNG to trade them on makes success more achievable.
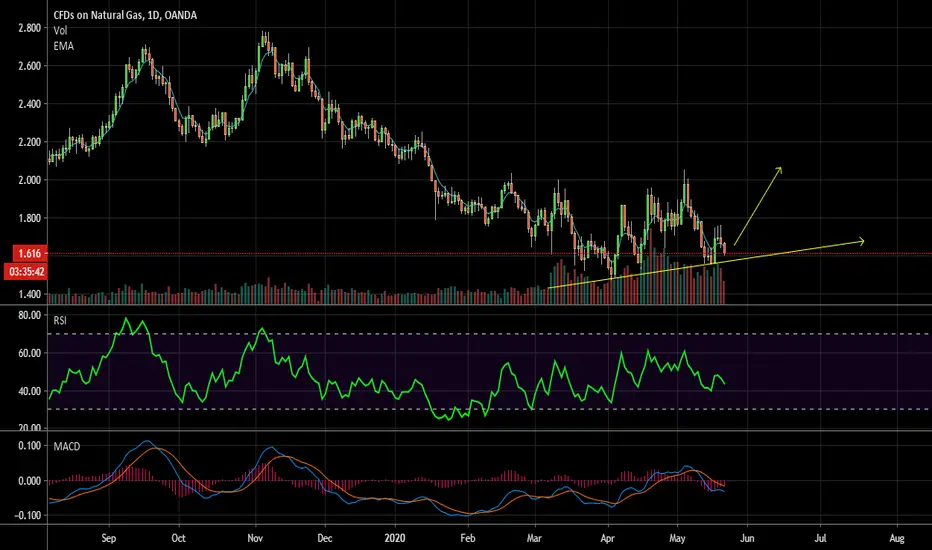
Just an observation
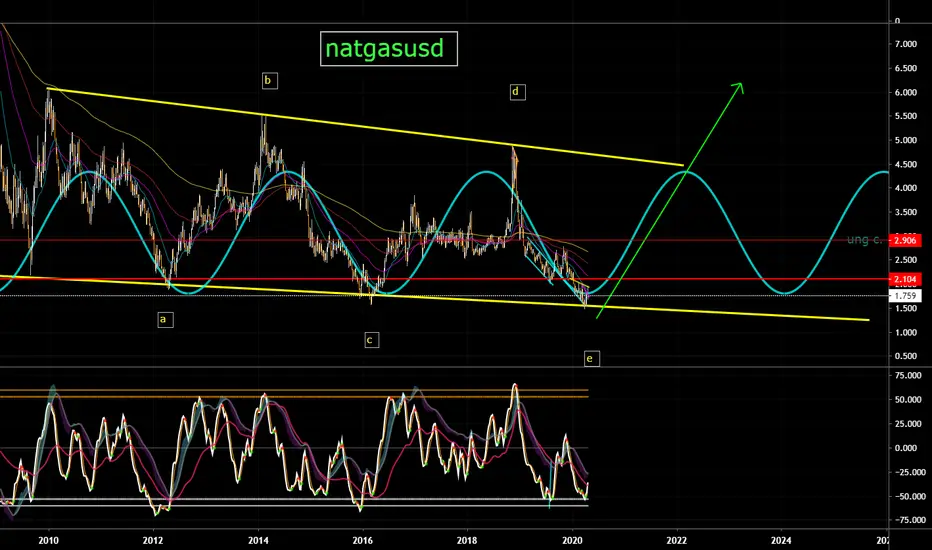
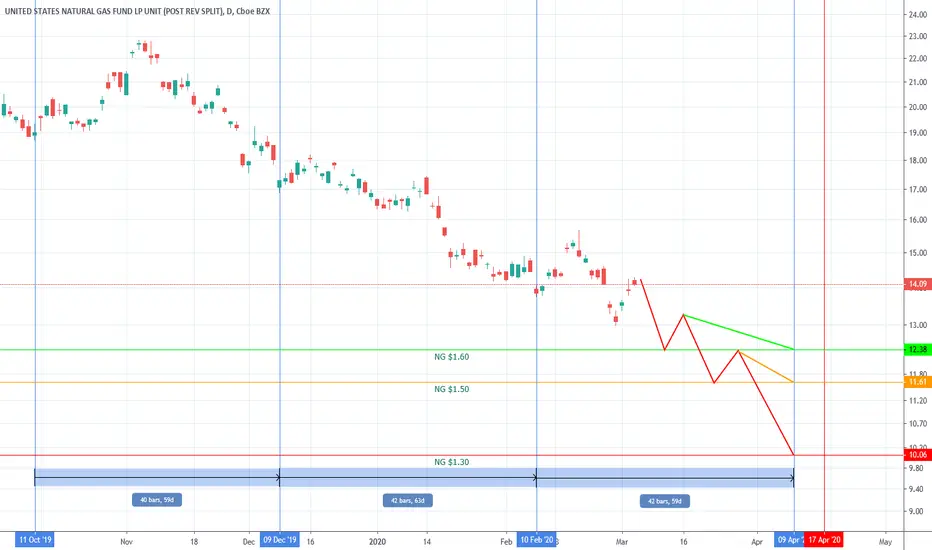
By no means a pro, just an observation I found. Will NG repeat this pattern? If so, suggest bottom will be $1.30-1.50

Natural Gas Countertrend Rally Position PlanningThis chart is position planning based on the Daily Cycles Target and Countertrend Rally charts published last week.
Patiently waiting for this rally to fail.
UNG puts take advantage of the expected decay.
Enter on confirmed bearish hourly trend change.
Exits:
extreme bullish reversal, exit if hourly down trend fails
bullish daily higher low, exit on hourly uptrend confirmed
bearish continuation, assess situation at each price target
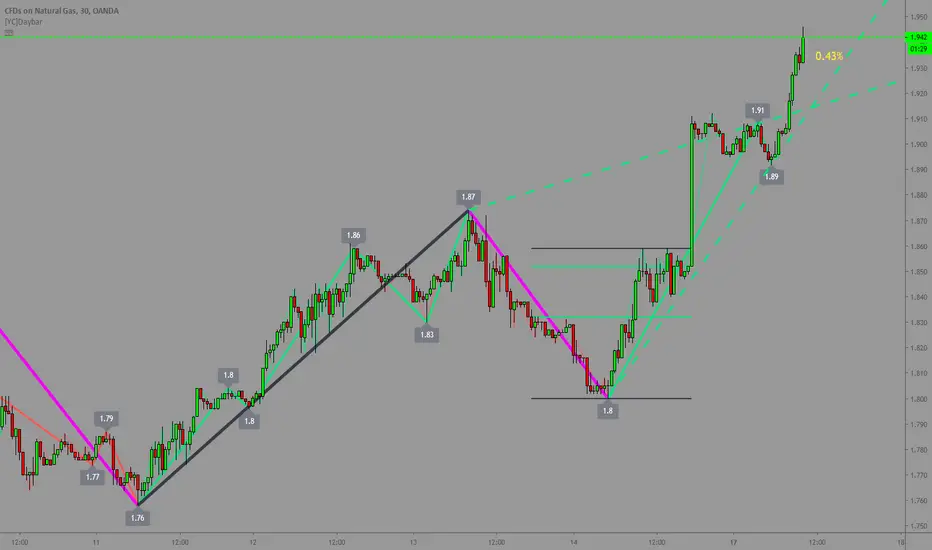
𝗡𝗮𝘁 𝗚𝗮𝘀 𝗨𝗽𝗱𝗮𝘁𝗲: $NG_F Daily. Appears to be turningMay pullback in the near-term, but with record short interest as long as above 1.87 looks good for a squeeze in coming month or two
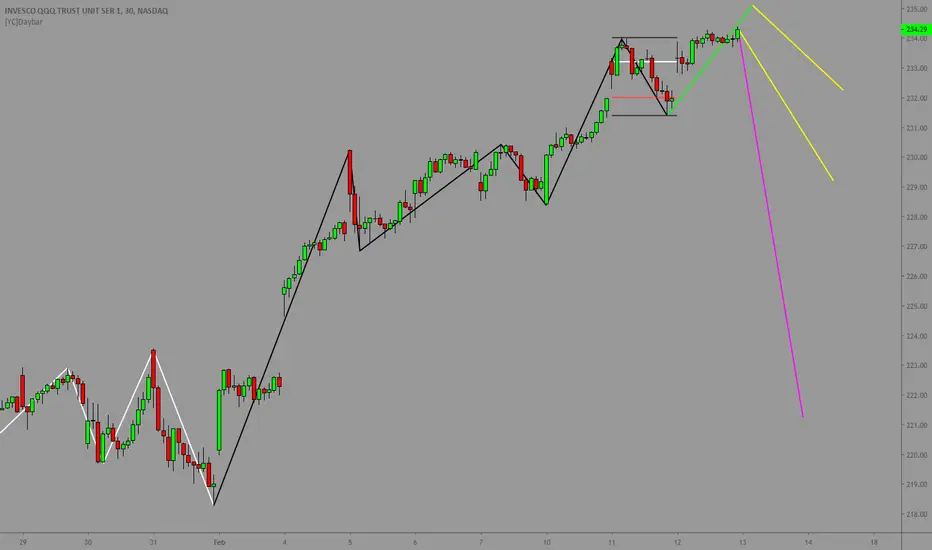
QQQ: trade review & tomorrow planTomorrow morning I will buy QQQ PUT
Today's trade:
XLE
XOP
GILD
UNG