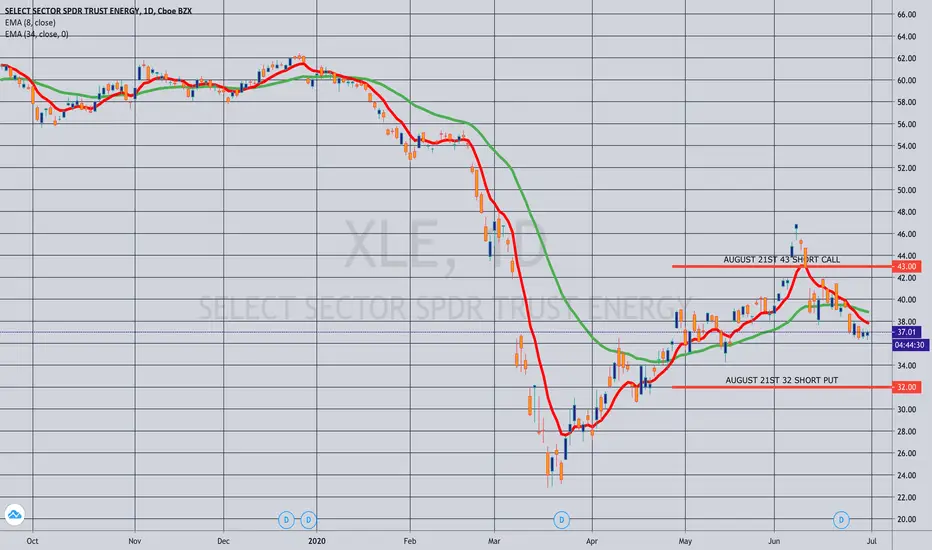
OPENING: XLE AUGUST 21ST 32/43 SHORT STRANGLE... for a 1.56/contract credit.
Notes: Camped out at the 20 delta with break evens at 30.44/44.56. Look to manage at side approaching worthless or break even test ... .
XLE
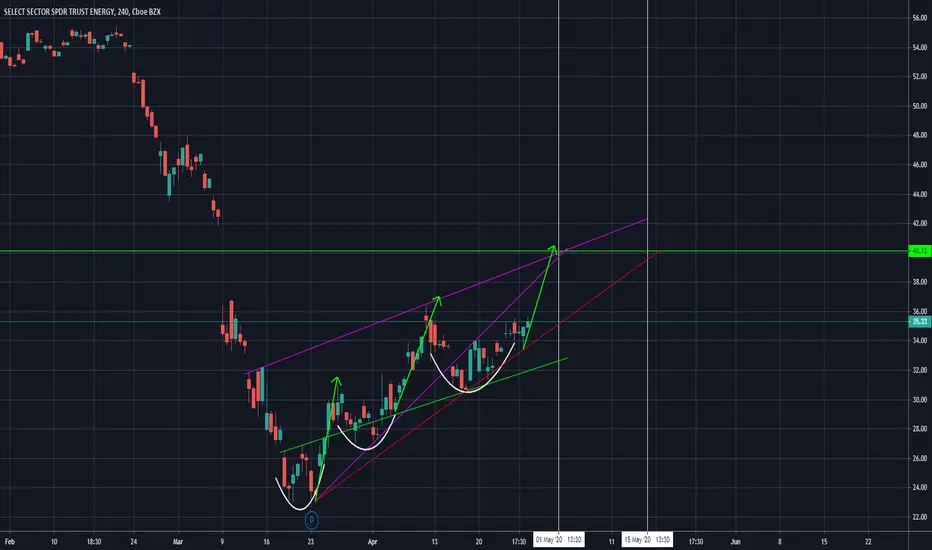
XLE ENERGY SECTOR - bouncing from Channel lowsAMEX:XLE is seen to bounce off channel lows & wedge breakout.
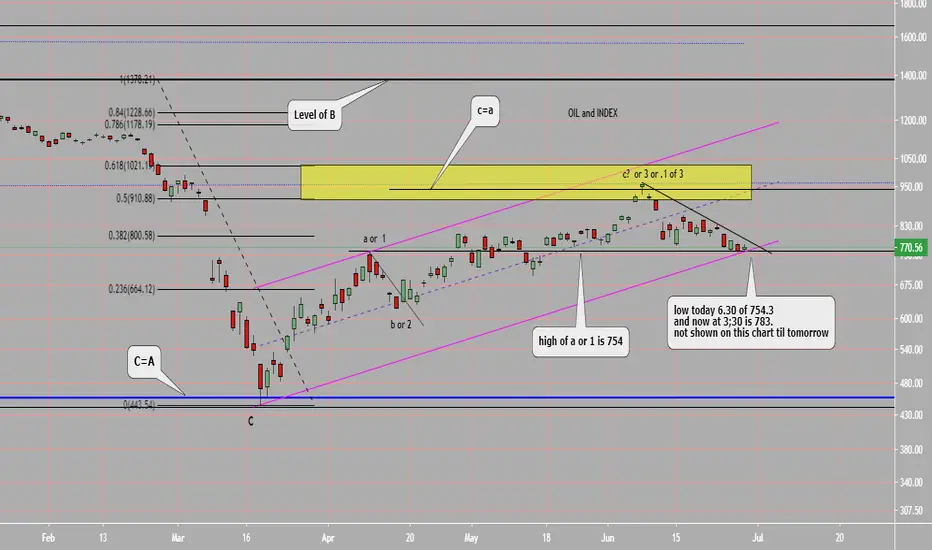
OIL index at critical point: updateThis is a follow up from my April post. (see link below if interested).
The target I had has been hit. We had a reversal candle today so far. So check after the close.
The low recently touched but did not go below the level "a or 1"(754) . If it does near term it would likely indicate that all this the up action is a correction. If it does not and price goes above the current near term downtrend line then likely we have more up action ahead.
I trade this with the XLE ETF. I went long today. Personally I will use a close below 754 as my stop. Process your way.
THE WEEK AHEAD: BBBY EARNINGS; XOP, XLE, EWW PREMIUM SELLINGEARNINGS:
Next week's earnings announcements are light, with options liquid underlying to play for volatility contract even lighter.
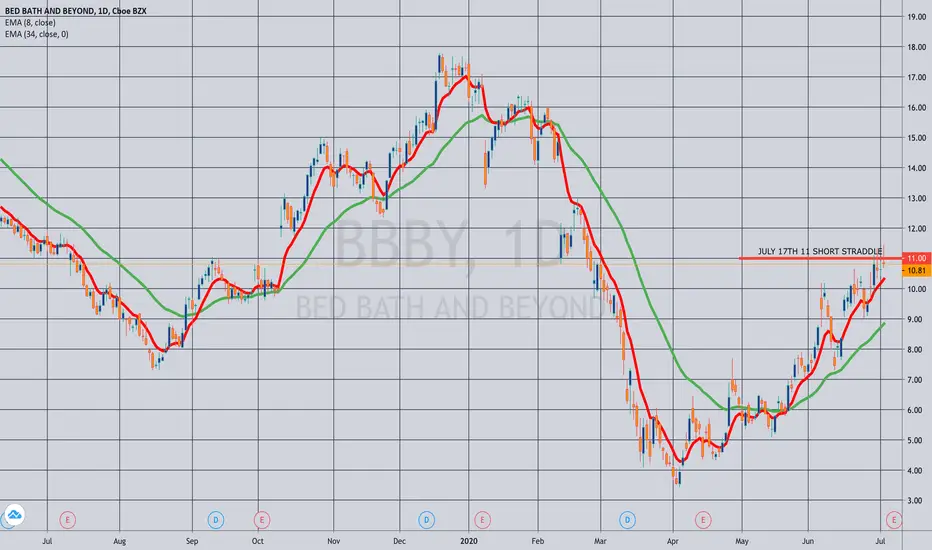
BBBY (52/119/18.8%*) announces on Wednesday after market close, so look to put on a play before the end of Wednesday's session. Pictured here is a July 17th (12 days) 11 short straddle, paying 2.03 as of Friday close, 18.8% of where the stock was trading at 10.81. Look to take profit at 25% max or otherwise manage the trade by rolling out to August if it doesn't work out fairly immediately.
DAL (43/89/12.3%*) also announces this week on Thursday. A July setup isn't paying much, so I'd be inclined to go out to August to make it more compelling, where the 23/36 short strangle paid 1.83 as of Friday close.
EXCHANGE-TRADED FUNDS ORDERED BY RANK/PERCENTILE AND SCREENED FOR >35% IMPLIED:
EWW (37/37/15.0%**)
EWZ (37/56/10.5%)
GDXJ (34/53/14.6%)
XLE (33/45/14.6%)
GDX (28/39/12.7%)
XOP (22/57/16.3%)
USO (9/51/13.2%)
The most bang for your buying power buck appears to lie in XOP, followed by EWW, XLE, and GDXJ.
BROAD MARKET:
IWM (41/36/10.0%)
IWM is the only broad market exchange-traded fund where the background implied remains greater than 35.
IRA DIVIDEND GENERATORS:
EWZ (37/56/10.5%)
... and EWZ the only dividend generator with a 30-day greater than 35.
* * *
Broad market volatility has come in quite a bit here, but SPY 30-day implied at 27.2% isn't exactly a "low volatility environment" either. Nevertheless, it's not a bad thing to sit back, let powder dry out a little bit in preparation for the next volatility wave and/or more productive earnings announcements, particularly with underlyings like NFLX, MSFT, and IBM announcing next week, along with a number of financials: C (36/55), WFC (45/54), BAC (33/48), JPM (32/43), MS (30/45), and GS (27/41).
* -- Percentage of stock price the July 17th short straddle was paying as of Friday close.
** -- Percentage of stock price the August 21st short straddle was paying as of Friday close.
THE WEEK AHEAD: ORCL, CCL, KMX EARNINGS; XLE, IWM, IYREARNINGS:
I'm not really seeing anything at the moment that meets my criteria for good liquidity, high rank/high implied to play this coming week for earnings-related volatility contraction plays.
While ORCL (53/44/9.8%) announces Tuesday after the market close, 30-day's only at 44 with the July at-the-money short straddle paying 9.8% of the stock price, which doesn't exactly get my motor running for a volatility contraction play.
CCL (47/142/31.6%) announces Thursday. It has the right volatility metrics and the July short straddle is paying a whopping 31.6% of the stock price, but most are playing this for a recovery from a coronavirus beat-down. For what it's worth, the July 15th 17 short put (19 delta; bullish assumption) is paying 1.17 at the mid price with a cost basis of 15.83 if assigned.
KMX (60/71/15.11%) announces on Friday morning, but isn't the most liquid thing in the world, with the July 17th 75/105 showing bid 3.60/mid 3.80/ask 4.00.
SECTOR EXCHANGE-TRADED FUNDS SCREENED FOR >35% 30-DAY:
XLE (55/61)
XLU (53/38)
SLV (51/38)
EWW (49/46)
GDXJ (49/63)
EWZ (45/61)
SMH (45/46)
GDX (45/41)
XOP (41/79)
USO (18/68)
Notes: I don't have any XLE on currently. The August 21st 32/48 (17 delta) is paying 1.76.
BROAD MARKET:
IWM (66/50)
EFA (42/36)
QQQ (41/34)
SPY (39/35)
Notes: If you're going to sell premium in broad market, small caps is probably the place to do it. Unfortunately, we're kind of mid-cycle here with July only having 34 days left in it and the August, 69, but if you're willing to go a bit longer with duration: IWM August 21st 113/159 (17 delta), paying 4.81.
DIVVY YIELDING EXCHANGE-TRADED FUNDS FOR THE IRA:
IYR (65/47)
EWA (57/44)
XLU (53/38)
EWZ (45/61)
HYG (45/26)
EFA (42/36)
SPY (39/35)
TLT (23/20)
EMB (23/18)
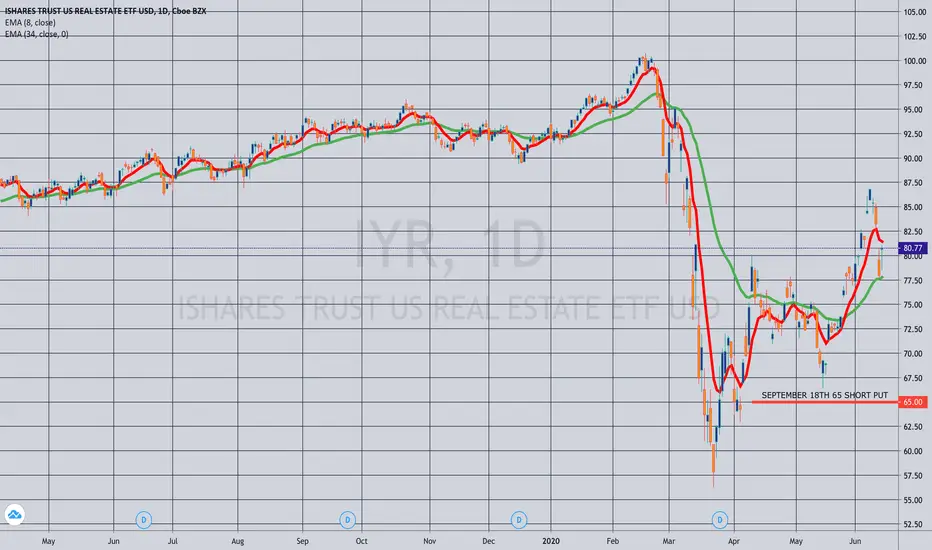
Notes: Pictured here is an IYR (3.51% yield) September 18th 65 short put paying 2.02 at the mid. I've been generally laddering out as an acquisitional play for the IRA, but July has only 34 days left, and there is currently no August (although there will probably be one post June opex), so a single September put would have to do.
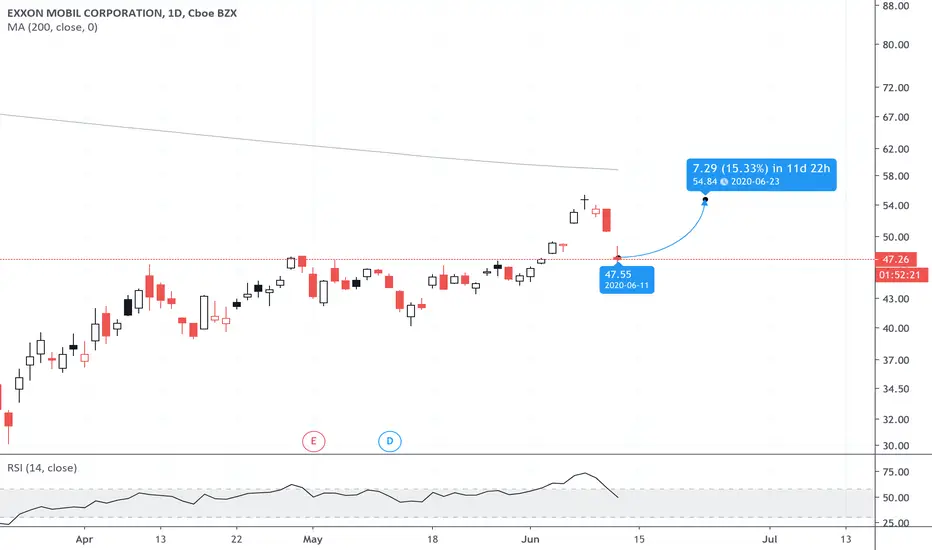
XOM calls low risk high reward?$XOM is even cheaper now. If the market wasn't getting spooked it might be rallying. Could take advantage of the opportunity to scoop up cheap $XOM calls, which would allow you to have a defined max loss and could have really high upside. Currently sitting this one off due to my rule not to enter too many positions at once, but I like the risk/reward here...

Xle 4 hr chart Just a quick look. Ascending triangle perhaps failure is near. Or breakout. It seems to be breakout but we will see which comes first. Short biased

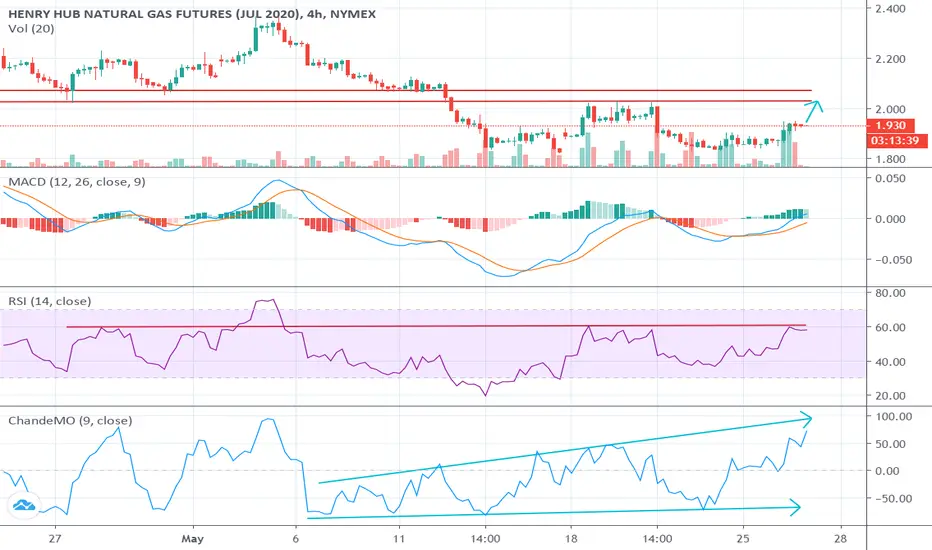
NG: Natural Gas futures gapped up switching to July contractNG: Natural Gas futures NG switched to July contract on May 26 at 18 p.m. gapping up to $1.93. Based on 4 Hr chart, resistance of $2.0 has not been reached yet indicating potential to go higher. MACD crossed pointing toward higher prices as well. RSI is at 60, which has been the level that capped the most recent rally at $2.0 (May 18 -22). Chande momentum is forming a "megaphone" pattern indicating some potential to go higher in the near-term.
UGAZ: Traded flat at $17.30 during NG gap up to $1.93. If $1.93 NG price is sustained overnight, expecting a gap up on the open for UGAZ, possibly up to $19-20 level.
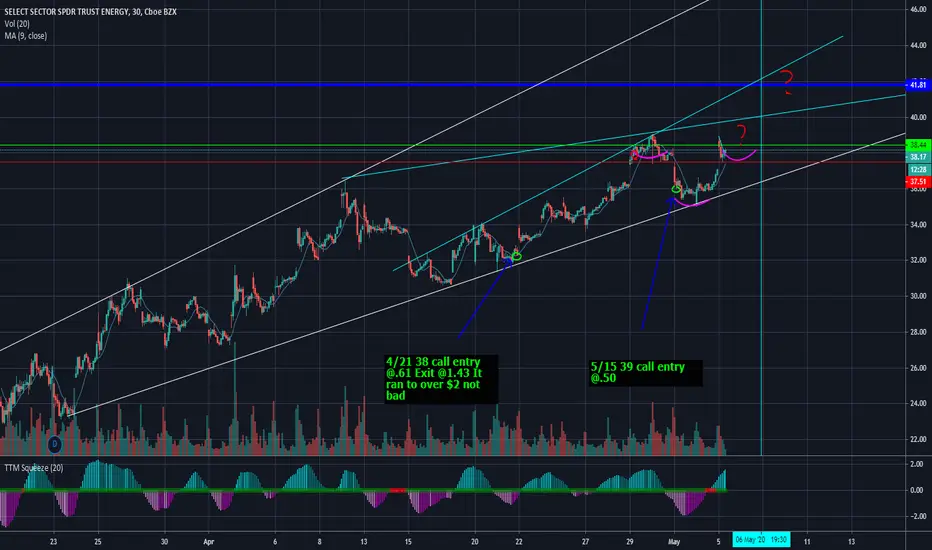
Doing a little consolidation against the resistanceLooking nice. 10 is over 20 and 20 is over 50, and consolidating between fibs. I believe there should be some upward movement coming.

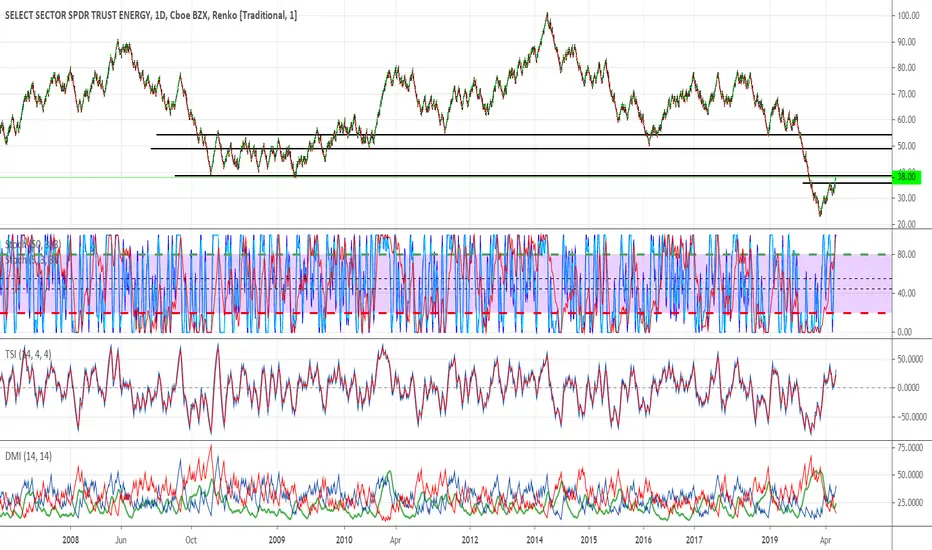
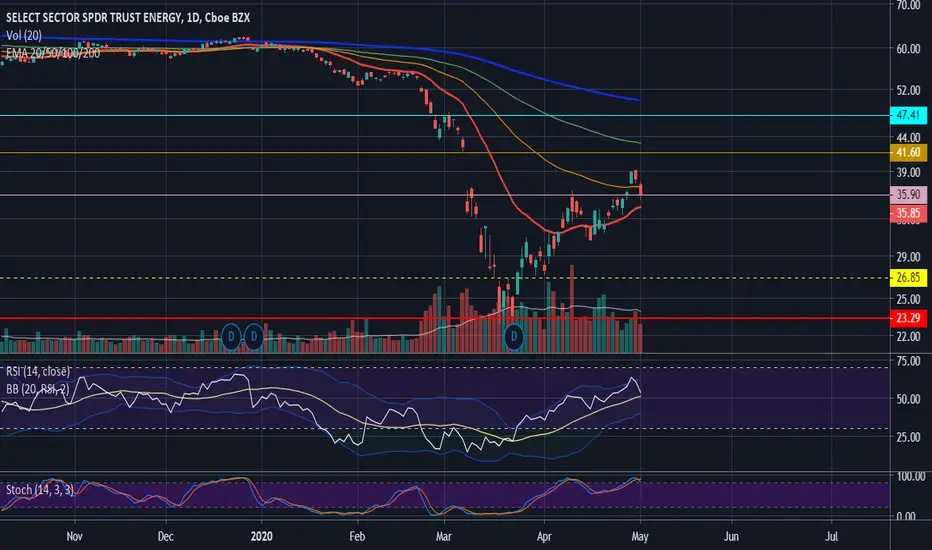
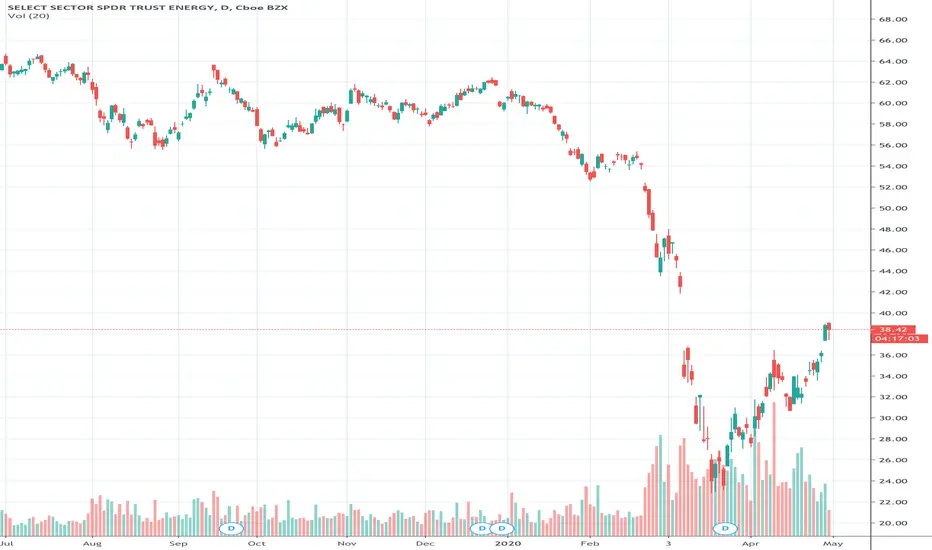
ENERGY SELECT SECTOR SPDR ETF ( $XLE 1D) the cup is full Everyone is well aware that the current state of the world economy is dire.
In my previous analysis I was following the price of WTI and USOIL (link below) but due to the MAY contract debacle the charts are now trash.
So, now to monitor the advancement of the recovery I will now use the Energy sector ETF XLE. It will not be a leading indicator as a transportation index would, but it can be a good indication of the overall economic activity or expectations.
The recent “crash” is what’s look like capitulation (high spread on high volumes). It could take time to recover. Maybe months.
On a daily time-frame however I identify a pseudo cup and handle pattern. Even if it’s not a full reversal on higher time-frames it can lead to a good swing trade.
The price is now retesting the neckline of the pattern ( 35.90) as a support, so it is a good entry point and a good way to manage risk.
Target 41.60 to close the gap then 47.41 last resistance.
The price made a double bottom several weeks ago.
Bullish div RSI
Let us see how all this will turn out.
As time goes by, I will keep you updated on the evolution of the asset price, so make sure to follow me on Tradingview
If you have any questions or requests, fell free to ask @Djio_ .
Disclaimer : This is not financial advice as I am not a financial adviser.
This is just my knowledge on what can be said and done from the chart.
Due to the volatile nature of the market, everything can change on a day to day basis.
Everyone is wise to manage their risk properly when considering any trading decision or activities.
PS: I cannot emphasize enough the risk associated with the activity of trading ETF due to the imaginary nature of all paper contracts, the reason why I prefer mainly trading cryptocurrencies instead of more “traditional” assets. On the other end without total systemic collapse it can quickly become a good trade opportunity .
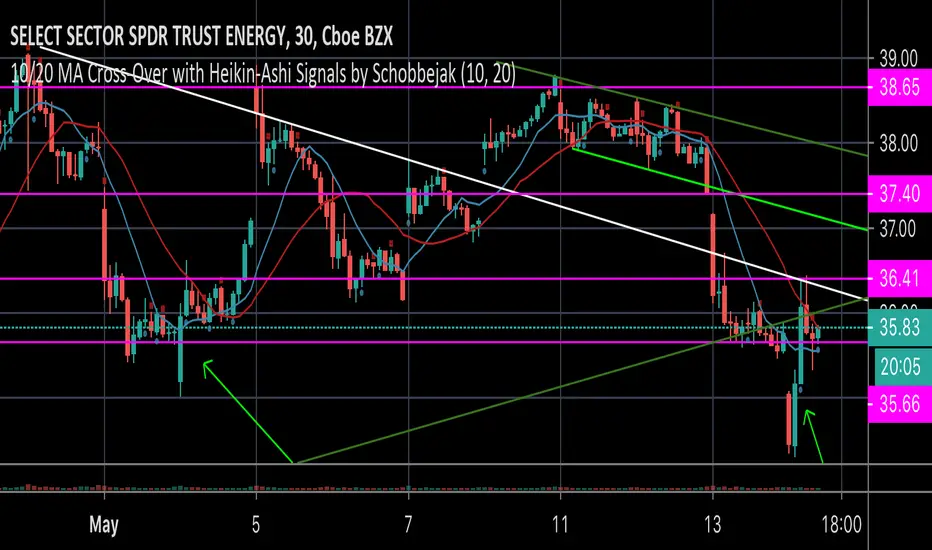
Xle pattern I made a good trade to the short side sold early yesterday now back in calls for now looking at a 30 min chart and similar pattern as before. Gap down run up
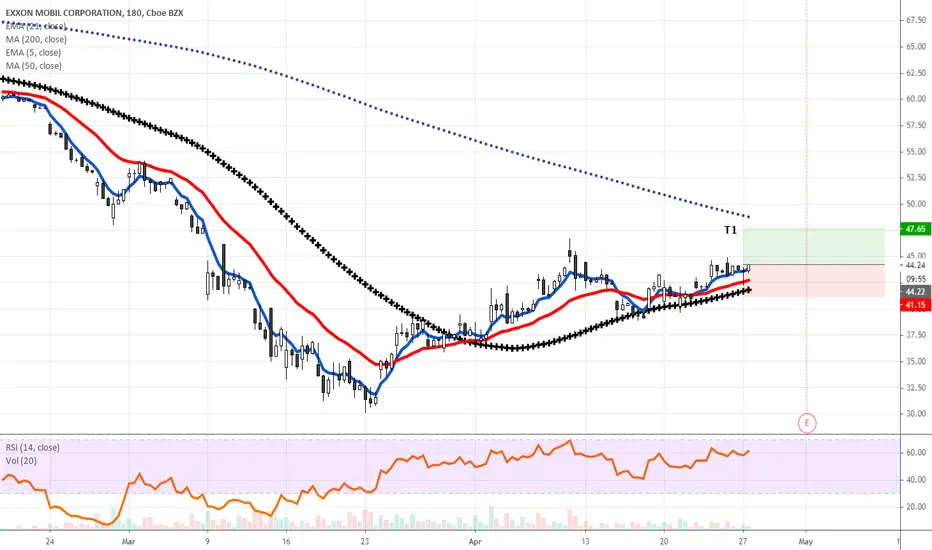
LONG XOMKeep your trading simple
Bullish Swing Long
T1 = minimum risk reward 1:1
I always leave 1/3 of my position for long term gains - moving my stop to my entry if I need to give room for the volatility or using trailing stop for maximum gains.
Not a financial advise - trade smart trade safe.
Follow me to support my work, Thanks!
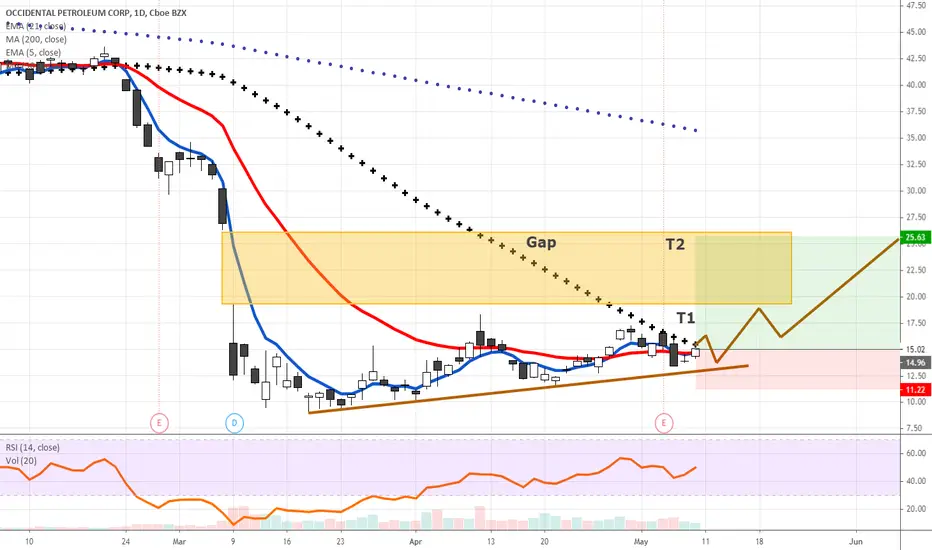
LONG OXYKeep your trading simple
Bullish Swing Long
Entry after the 50MA, Smaller position then usual because of the volatility and big price swings.
T1 = minimum risk reward 1:1
I always leave 1/3 of my position for long term gains - moving my stop to my entry if I need to give room for the volatility or using trailing stop for maximum gains.
Not a financial advise - trade smart trade safe.
Follow me to support my work, Thanks!
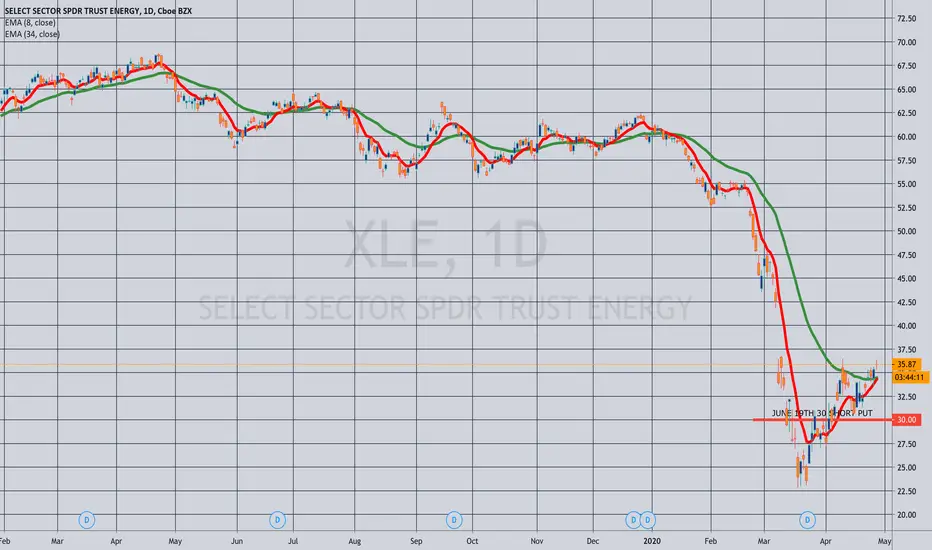
OPENING: XLE JUNE 19TH 30 SHORT PUT... for a 1.06 credit/contract.
Notes: With rank/implied at 47/57, going bullish assumption here with the notion that oil prices recover somewhat as COVID-related restrictions lift. My general go-to is short strangle, but didn't want to get whipped on the call side if the recovery is dramatic.

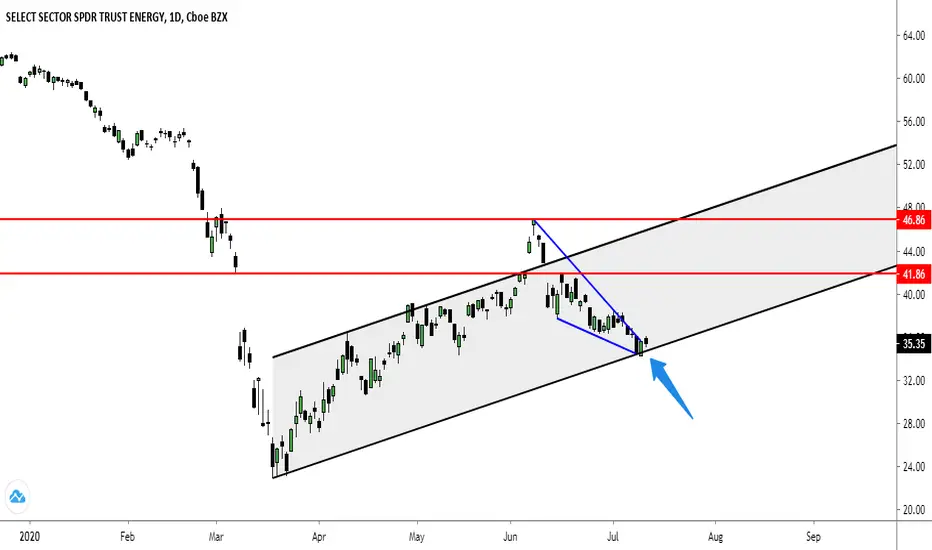
XLE mid lineI feel like you study and study and study a chart and sometimes you start to see things you haven't seen before. that's 14 touches on that lines in a little over a month. More of an observation than anything.


Oil Prices Will Determine Where The Stock Market Goes From HereWhile the stock market continues to march higher, economic fundamentals continue to deteriorate. Forward-looking in nature, the stock market tends to discount (ignore) what is happening now in anticipation of what is to come over the next 6-9 months. Although top-down stimulus from central banks and governments have propped up financial markets, economic data points across the globe are signaling a prolonged downturn. For the first time in modern history (BP started keeping recording in 1861), WTI oil prices traded into negative territory reaching $-36.20 per barrel. In essence, storage facilities were giving away oil because they had no more room to store it. Oil markets have been telling us what is truly going on. But are investors listening?
Two weeks ago, OPEC+ decided to cut oil production by approximately 9.7 million barrels per day starting in May. Since that time, energy prices have been extremely volatile, falling further. Why did oil prices continue to fall despite the cut in supply? Lack of demand. Despite the fact that OPEC+ vowed to cut global supply by 10%, the gap between supply and demand has grown. Since the coronavirus accelerated, global demand for oil has fallen by 30%, leaving a 20% (20 million barrels per day) gap after accounting for OPEC+ cuts that start next month.
The lack of demand has been widespread. According to Rystad Energy AS and the Trafigura Group, energy demand is expected to fall by 28-35 million barrels per day. U.S. oil demand has fallen 30% to 14.4 million barrels a day, the lowest level going back to 1990. In its short-term outlook, the EIA forecasts the hit to oil demand will be 16.7 million barrels a day. According to country officials, India’s crude demand (third-biggest consumer) has collapsed by ~70% as the country endures the largest national lockdown. Canadian oil producers expect the gap between supply and demand to reach more than 1.1 million barrels a day in the second quarter. In Spain, oil product demand fell by 23% in March. With gasoline and road diesel falling by 35.5% and 26.5% respectively. In Italy, which together with Spain imposed some of Europe’s harshest restrictions on movement, retail fuel sales have plunged 85%.
The relationship between the S&P 500 and oil prices has strengthened over the last six weeks. The correlation (relationship) stood at .07 (statistically insignificant) in the middle of February, that figure now stands at .86 (statistically significant). Assuming there are no sizable policy stimulus that distorts prices further, I expect oil prices to dictate where the stock prices go from here. Oil price increases driven by short-term reductions in supply will not be enough. Globally, oil makes up 34% of our energy usage. Only an increase in demand will signal a genuine economic recovery. At some point, the stock market and economic fundamentals will need to be reconciled.
-Appo Agbamu, CFA
This material is for informational purposes only. Under no circumstances should any information or materials presented be used or construed as an offer to sell, or a solicitation of an offer to buy, any securities, financial instruments, investments, or other services. Any investment made is at your sole discretion. There are many factors that you must consider when making an investment decision, including, but not limited to, product features, risks, whether or not an investment meets your investment objectives, risk tolerance, and other personalized factors. Investing in securities involves risks, and there is always the potential of losing your entire investment.
XLE hitting long term resistance.XLE looks like hitting long term resistance. a break above the 38.3/4 level could signal much higher prices to test bottom of previous support