OPEN-SOURCE SCRIPT
Updated Ultimate Correlation Coefficient
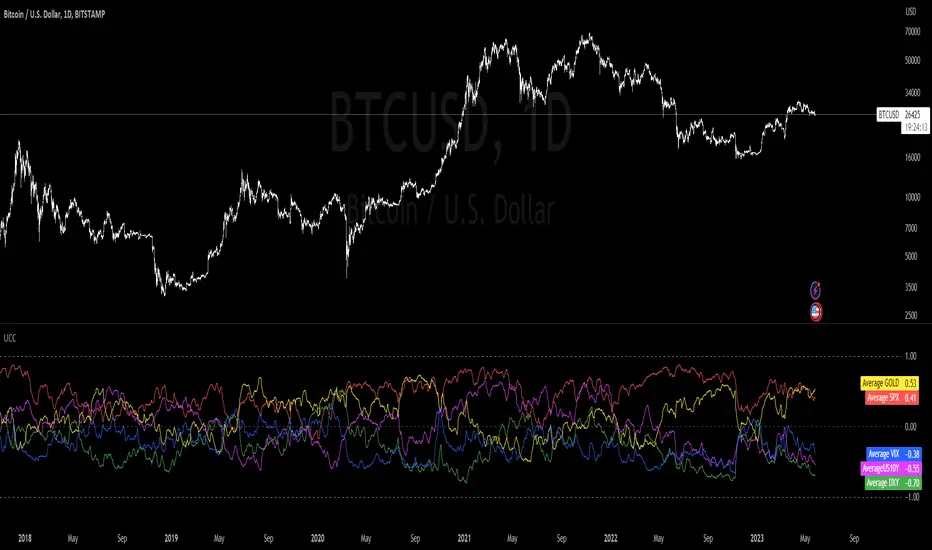
It contains the Correlations for  SPX,
SPX,  DXY, $CURRENCYCOM:GOLD,
  US10Y and VIX and is intended for
  BTCUSD, but works fine for most other charts as well.
Don't worry about the colored mess, what you want is to export your chart ->
TradingView: How can I export chart data?
and then use the last line in the csv file to copy your values into a correlation table.
Order is:
SPX
DXY
GOLD
US10Y
VIX
Your last exported line should look like this:
2023-05-25T02:00:00+02:00 26329.56 26389.12 25873.34 26184.07 0 0.255895534 -0.177543633 0.011944815 0.613678565 0.387705043 0.696003298 0.566425278 0.877838156 0.721872645 0 -0.593674719 -0.839538073 -0.662553817 -0.873684242 -0.695764534 -0.682759656 -0.54393749 -0.858188808 -0.498548691 0 0.416552489 0.424444345 0.387084882 0.887054782 0.869918437 0.88455388 0.694720993 0.192263269 -0.138439783 0 -0.39773255 -0.679121698 -0.429927048 -0.780313396 -0.661460134 -0.346525721 -0.270364046 -0.877208139 -0.367313687 0 -0.615415111 -0.226501775 -0.094827955 -0.475553396 -0.408924242 -0.521943234 -0.426649404 -0.266035908 -0.424316191
The zeros are thought as a demarcation for ease of application :
2023-05-25T02:00:00+02:00 26329.56 26389.12 25873.34 26184.07 0 -> unused
// 15D 30D 60D 90D 120D 180D 360D 600D 1000D
0.255895534 -0.177543633 0.011944815 0.613678565 0.387705043 0.696003298 0.566425278 0.877838156 0.721872645 -> SPX
0
-0.593674719 -0.839538073 -0.662553817 -0.873684242 -0.695764534 -0.682759656 -0.54393749 -0.858188808 -0.498548691 -> DXY
0
0.416552489 0.424444345 0.387084882 0.887054782 0.869918437 0.88455388 0.694720993 0.192263269 -0.138439783 -> GOLD
0
-0.39773255 -0.679121698 -0.429927048 -0.780313396 -0.661460134 -0.346525721 -0.270364046 -0.877208139 -0.367313687 -> US10Y
0
-0.615415111 -0.226501775 -0.094827955 -0.475553396 -0.408924242 -0.521943234 -0.426649404 -0.266035908 -0.424316191 -> VIX
Release Notes
Now Display's the average instead of the color mess... Little change to exported csv data, last 6 columns are new, containing 0 as demarcation and the following 5 are the average value of the Correlations in the same order as above:
Should make it slightly more appealing visually
Release Notes
slight visual fixOpen-source script
In true TradingView spirit, the creator of this script has made it open-source, so that traders can review and verify its functionality. Kudos to the author! While you can use it for free, remember that republishing the code is subject to our House Rules.
No statements or claims aim to be financial advice,
neither are any signals from us or our indicators.
Want to learn Trading, Investing or system building?
Join the Community via Discord or Website! 👇
discord.gg/FMZDM3bZ9T
neither are any signals from us or our indicators.
Want to learn Trading, Investing or system building?
Join the Community via Discord or Website! 👇
discord.gg/FMZDM3bZ9T
Disclaimer
The information and publications are not meant to be, and do not constitute, financial, investment, trading, or other types of advice or recommendations supplied or endorsed by TradingView. Read more in the Terms of Use.
Open-source script
In true TradingView spirit, the creator of this script has made it open-source, so that traders can review and verify its functionality. Kudos to the author! While you can use it for free, remember that republishing the code is subject to our House Rules.
No statements or claims aim to be financial advice,
neither are any signals from us or our indicators.
Want to learn Trading, Investing or system building?
Join the Community via Discord or Website! 👇
discord.gg/FMZDM3bZ9T
neither are any signals from us or our indicators.
Want to learn Trading, Investing or system building?
Join the Community via Discord or Website! 👇
discord.gg/FMZDM3bZ9T
Disclaimer
The information and publications are not meant to be, and do not constitute, financial, investment, trading, or other types of advice or recommendations supplied or endorsed by TradingView. Read more in the Terms of Use.