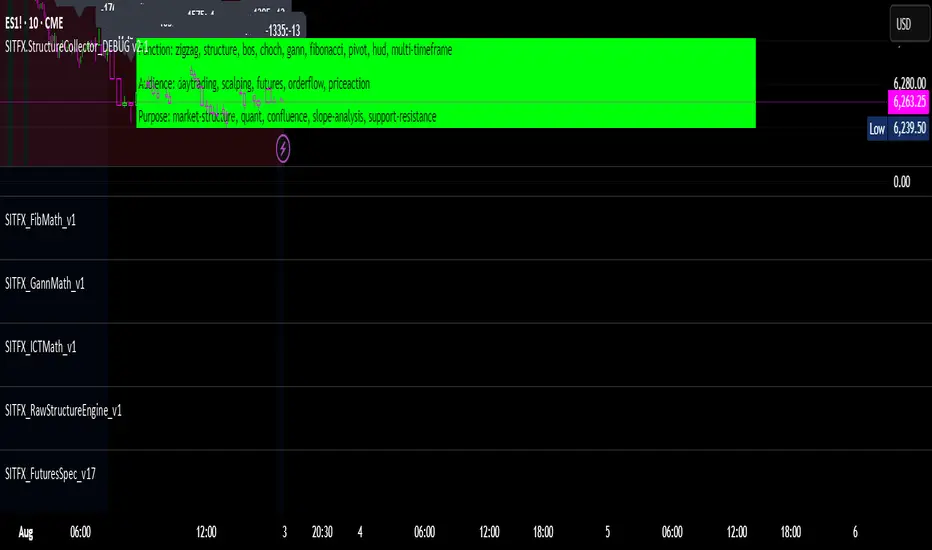
SITFX_FuturesSpec_v17SITFX_FuturesSpec_v17 – Universal Futures Contract Library
Full-scale futures contract specification library for Pine Script v6. Covers CME, CBOT, NYMEX, COMEX, CFE, Eurex, ICE, and more – including minis, micros, metals, energies, FX, and bonds.
Key Features:
✅ Instrument‑agnostic: ES/MES, NQ/MNQ, YM/MYM, RTY/M2K, metals, energies, FX, bonds
✅ Full contract data: Tick size, tick value, point value, margins
✅ Continuation‑safe: Single‑line logic, no arrays or continuation errors
✅ Foundation for SITFX tools: Gann, Fibs, structure, and risk modules
Usage example:
import SITFX_FuturesSpec_v17/1 as fs
spec = fs.get(syminfo.root)
label.new(bar_index, high, str.format("{0}: Tick={1}, Value=${2}", spec.name, spec.tickSize, spec.tickValue))
Indicators and strategies
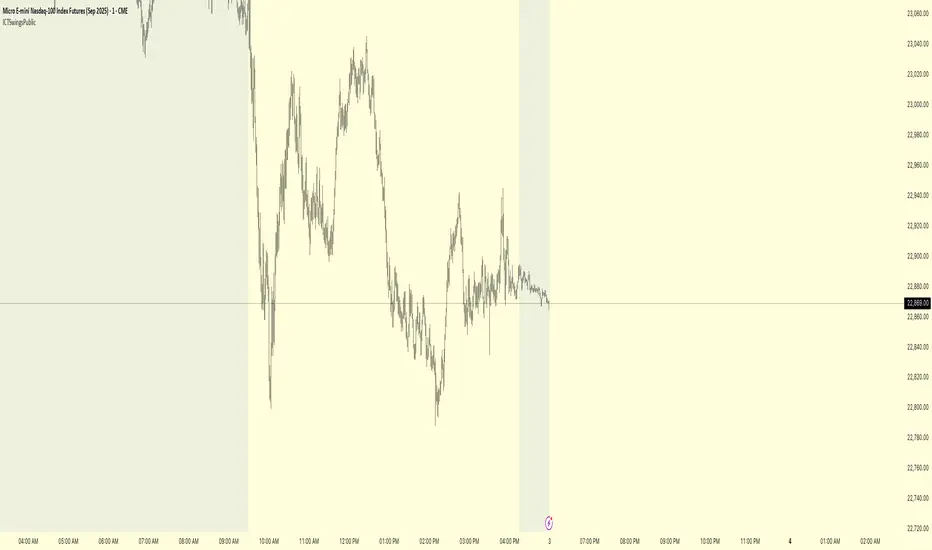
ICTHL_PublicLibrary "ICTSwingsPublic"
f_ictSwings(leftStrength, rightStrength, maxLines, highColor, lowColor)
Parameters:
leftStrength (int)
rightStrength (int)
maxLines (int)
highColor (color)
lowColor (color)
SMC_CommonLibrary "SMC_Common"
Common types and utilities for Smart Money Concepts indicators
get_future_time(bars_ahead)
Parameters:
bars_ahead (int)
get_time_at_offset(offset)
Parameters:
offset (int)
get_mid_time(time1, time2)
Parameters:
time1 (int)
time2 (int)
timeframe_to_string(tf)
Parameters:
tf (string)
is_psychological_level(price)
Parameters:
price (float)
detect_swing_high(src_high, lookback)
Parameters:
src_high (float)
lookback (int)
detect_swing_low(src_low, lookback)
Parameters:
src_low (float)
lookback (int)
detect_fvg(h, l, min_size)
Parameters:
h (float)
l (float)
min_size (float)
analyze_volume(vol, volume_ma)
Parameters:
vol (float)
volume_ma (float)
create_label(x, y, label_text, bg_color, label_size, use_time)
Parameters:
x (int)
y (float)
label_text (string)
bg_color (color)
label_size (string)
use_time (bool)
SwingPoint
Fields:
price (series float)
bar_index (series int)
bar_time (series int)
swing_type (series string)
strength (series int)
is_major (series bool)
timeframe (series string)
LiquidityLevel
Fields:
price (series float)
bar_index (series int)
bar_time (series int)
liq_type (series string)
touch_count (series int)
is_swept (series bool)
quality_score (series float)
level_type (series string)
OrderBlock
Fields:
start_bar (series int)
end_bar (series int)
start_time (series int)
end_time (series int)
top (series float)
bottom (series float)
ob_type (series string)
has_liquidity_sweep (series bool)
has_fvg (series bool)
is_mitigated (series bool)
is_breaker (series bool)
timeframe (series string)
mitigation_level (series float)
StructureBreak
Fields:
level (series float)
break_bar (series int)
break_time (series int)
break_type (series string)
direction (series string)
is_confirmed (series bool)
source_swing_bar (series int)
source_time (series int)
SignalData
Fields:
signal_type (series string)
entry_price (series float)
stop_loss (series float)
take_profit (series float)
risk_reward_ratio (series float)
confluence_count (series int)
confidence_score (series float)
strength (series string)

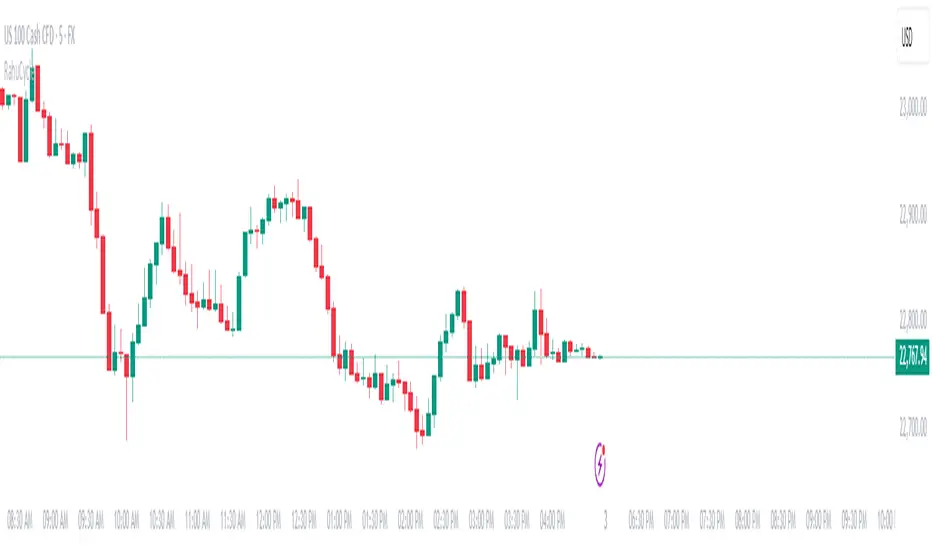
RahuCycleLibrary "RahuCycle"
drawRahuTable(table_position, table_size)
Parameters:
table_position (string)
table_size (string)
getBackgroundColor()
drawEventLabels()
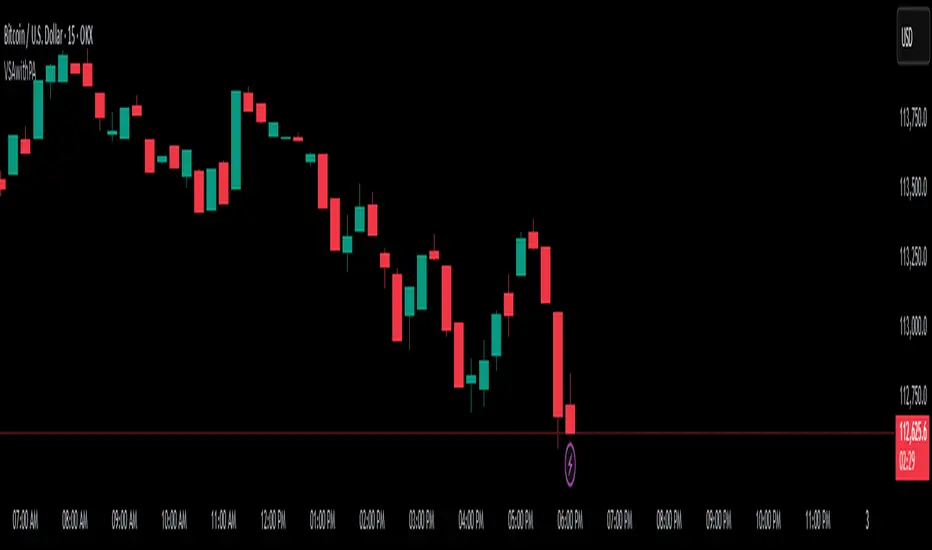
VSAwithPALibrary "VSAwithPA"
getVsaSignal(vol_ma_len, avgs, ma_type, red_thresh, orange_thresh, yellow_thresh, blue_thresh)
Calculates the core VSA signal.
Parameters:
vol_ma_len (simple int)
avgs (int)
ma_type (string)
red_thresh (float)
orange_thresh (float)
yellow_thresh (float)
blue_thresh (float)
Returns: A tuple: .
format_vertical(_text)
Formats a string to be displayed vertically.
Parameters:
_text (string)
plotVsaLabel(show_labels, labelText, use_vertical_labels, label_size_option, label_pos_option, y_level_for_line, candleColor)
Plots a VSA label on the chart.
Parameters:
show_labels (bool)
labelText (string)
use_vertical_labels (bool)
label_size_option (string)
label_pos_option (string)
y_level_for_line (float)
candleColor (color)
drawVsaLine(show_lines, show_signal_line, delete_prev_lines, prev_line, y_level, line_color, line_width, line_style_option, line_extend_option)
Draws a horizontal line for a VSA signal.
Parameters:
show_lines (bool)
show_signal_line (bool)
delete_prev_lines (bool)
prev_line (line)
y_level (float)
line_color (color)
line_width (int)
line_style_option (string)
line_extend_option (string)
Returns: (line) The ID of the newly created line.
getWcma(show, len)
CORRECTED: Calculates a Weighted Close Moving Average and returns the value.
Parameters:
show (bool)
len (int)
Returns: (series float) The calculated WCMA value, or na.
BestTimeFrameFinderLibrary "BestTimeFrameFinder"
adx(len)
Parameters:
len (simple int)
atrPercent(len)
Parameters:
len (simple int)
scaleFromTf(tf, atrWeight)
Parameters:
tf (string)
atrWeight (simple float)
scoreLocal(adxLen, atrLen, scale)
Parameters:
adxLen (simple int)
atrLen (simple int)
scale (simple float)
maxInArray(arr)
Parameters:
arr (array)

seed_data_library_5Library "seed_data_library_5"
setCombinedMap2A(m)
Parameters:
m (map)
setCombinedMap2B(m)
Parameters:
m (map)
getMarketCap(ticker)
Parameters:
ticker (string)
getRSRating(ticker)
Parameters:
ticker (string)
getIndustry(ticker)
Parameters:
ticker (string)
getSector(ticker)
Parameters:
ticker (string)

seed_data_library_4Library "seed_data_library_4"
setCombinedMap1A(m)
Parameters:
m (map)
setCombinedMap1B(m)
Parameters:
m (map)
getMarketCap(ticker)
Parameters:
ticker (string)
getRSRating(ticker)
Parameters:
ticker (string)
getIndustry(ticker)
Parameters:
ticker (string)
getSector(ticker)
Parameters:
ticker (string)
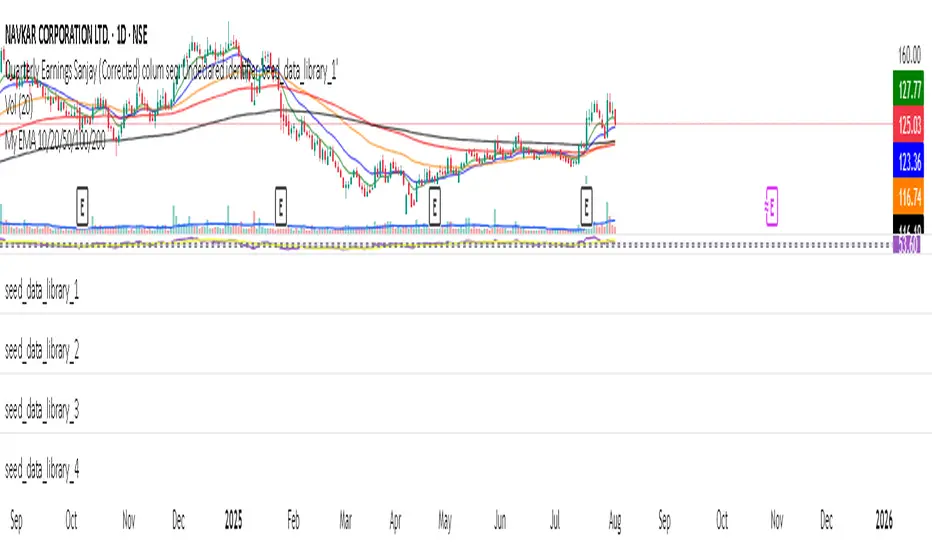
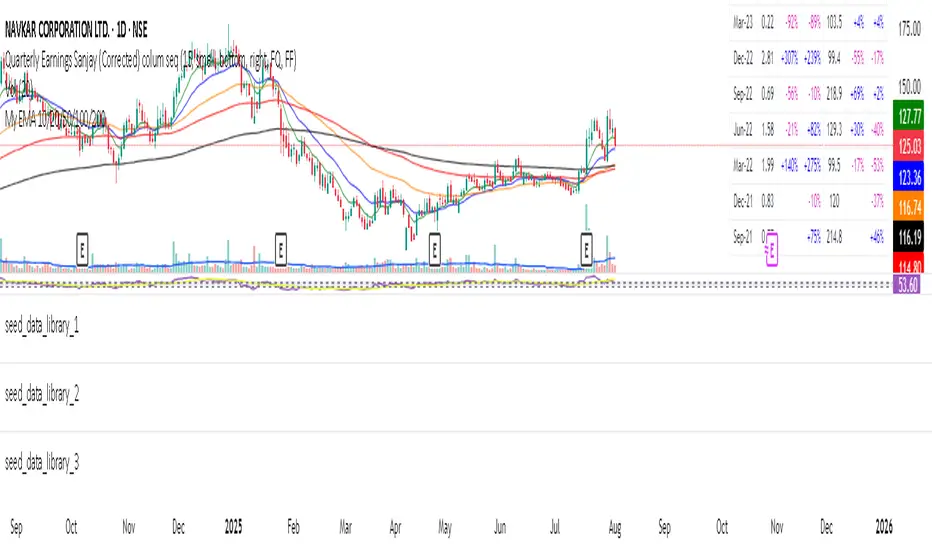
seed_data_library_3Library "seed_data_library_3"
setCombinedMap3A(m)
Parameters:
m (map)
setCombinedMap3B(m)
Parameters:
m (map)
getMarketCap(ticker)
Parameters:
ticker (string)
getRSRating(ticker)
Parameters:
ticker (string)
getIndustry(ticker)
Parameters:
ticker (string)
getSector(ticker)
Parameters:
ticker (string)

seed_data_library_2Library "seed_data_library_2"
setCombinedMap2A(m)
Parameters:
m (map)
setCombinedMap2B(m)
Parameters:
m (map)
getMarketCap(ticker)
Parameters:
ticker (string)
getRSRating(ticker)
Parameters:
ticker (string)
getIndustry(ticker)
Parameters:
ticker (string)
getSector(ticker)
Parameters:
ticker (string)

seed_data_library_1Library "seed_data_library_1"
setCombinedMap1A(m)
Parameters:
m (map)
setCombinedMap1B(m)
Parameters:
m (map)
getMarketCap(ticker)
Parameters:
ticker (string)
getRSRating(ticker)
Parameters:
ticker (string)
getIndustry(ticker)
Parameters:
ticker (string)
getSector(ticker)
Parameters:
ticker (string)
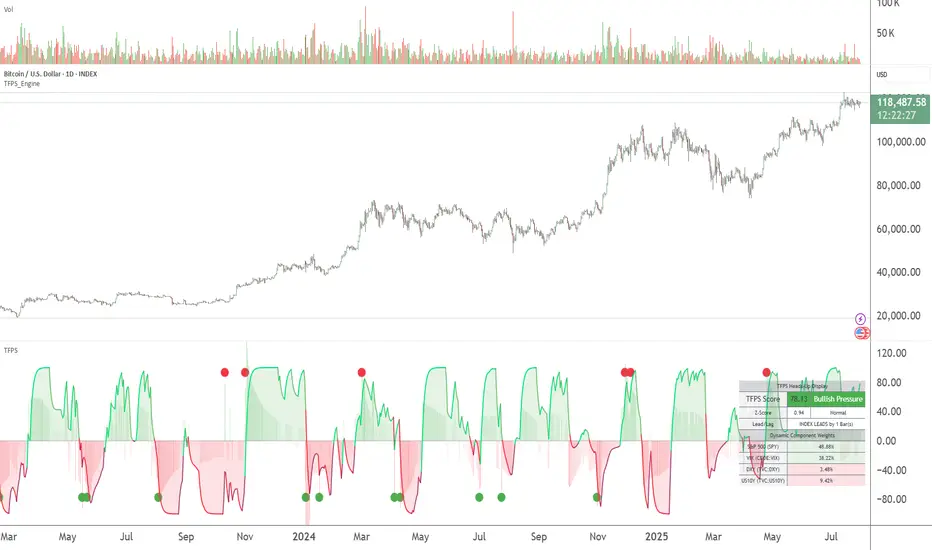
TFPS_EngineLibrary "TFPS_Engine"
f_calculate_lead_lag(series1, series2, length, max_lag)
Parameters:
series1 (float)
series2 (float)
length (int)
max_lag (int)
f_calculate_pressure_score(spx_ticker, vix_ticker, dxy_ticker, us10y_ticker, benchmark_source, trend_lookback, score_smoothing, use_dynamic_weights, corr_lookback, w_spx, w_vix, w_dxy, w_us10y, zscore_lookback, max_lag)
Parameters:
spx_ticker (string)
vix_ticker (string)
dxy_ticker (string)
us10y_ticker (string)
benchmark_source (float)
trend_lookback (int)
score_smoothing (simple int)
use_dynamic_weights (bool)
corr_lookback (int)
w_spx (float)
w_vix (float)
w_dxy (float)
w_us10y (float)
zscore_lookback (int)
max_lag (int)
LeadLagOutput
Fields:
best_lag (series int)
max_corr (series float)
TFPS_Output
Fields:
historical_score (series float)
smoothed_score (series float)
z_score (series float)
regime_signal (series int)
lead_lag_bars (series int)
lead_lag_corr (series float)
weight_spx (series float)
weight_vix (series float)
weight_dxy (series float)
weight_us10y (series float)
FunctionADFLibrary "FunctionADF"
Augmented Dickey-Fuller test (ADF), The ADF test is a statistical method used to assess whether a time series is stationary – meaning its statistical properties (like mean and variance) do not change over time. A time series with a unit root is considered non-stationary and often exhibits non-mean-reverting behavior, which is a key concept in technical analysis.
Reference:
-
- rtmath.net
- en.wikipedia.org
adftest(data, n_lag, conf)
: Augmented Dickey-Fuller test for stationarity.
Parameters:
data (array) : Data series.
n_lag (int) : Maximum lag.
conf (string) : Confidence Probability level used to test for critical value, (`90%`, `95%`, `99%`).
Returns: `adf` The test statistic. \
`crit` Critical value for the test statistic at the 10 % levels. \
`nobs` Number of observations used for the ADF regression and calculation of the critical values.

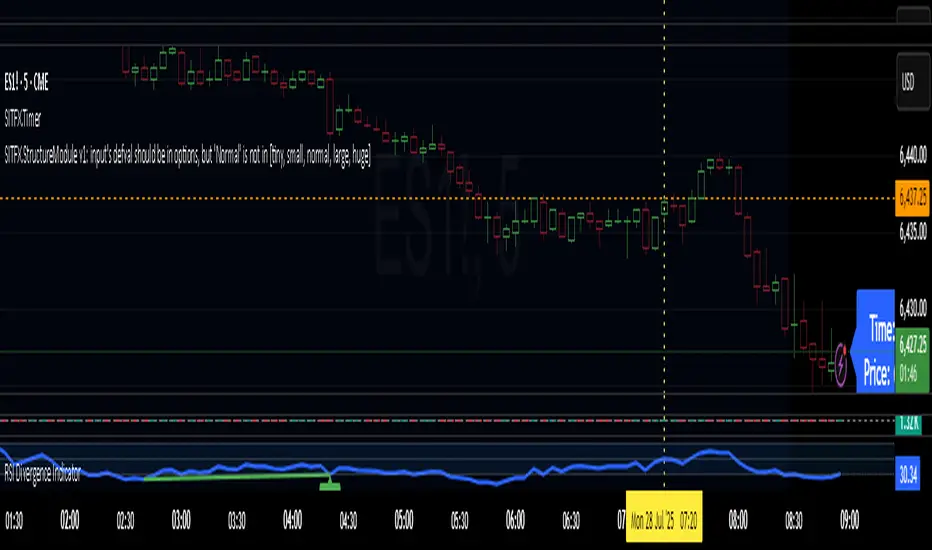
BarUtils: Get Bar Index from DateLibrary "BarUtils"
getBarIndexFromDate(targetTimestamp)
Parameters:
targetTimestamp (int)
**Description**:
This utility provides a reliable way to calculate the `bar_index` of a specific calendar date, regardless of chart resolution. It's especially useful for anchoring scripts to historical events, labeling macroeconomic moments, or marking custom time-based signals that must remain consistent across timeframes.
Unlike hardcoded `bar_index - N` approaches, this function dynamically estimates the number of bars between a given `timestamp()` and the current bar using the actual time-per-bar (`time - time `). It works correctly on intraday, daily, weekly, and monthly charts.
### 💡 **Function Provided**:
import TradeTitan120/BarUtils/1
* `getBarIndexFromDate(int targetTimestamp)`
→ Returns the estimated `bar_index` that aligns with a given timestamp
### ✅ **Use Cases**:
* Marking past events like FOMC meetings, market crashes, or personal signals
* Backtesting entry/exit conditions from specific calendar dates
* Anchoring visual elements (shapes, lines, labels) across resolutions
This tool is simple, fast, and built for accuracy. Use it to enhance multi-timeframe compatibility in any script.
lib_listaAtivos_PosseidonLibrary "lib_listaAtivos_Posseidon"
TODO: add library description here
ativos(loteSelected)
TODO: add function description here
Parameters:
loteSelected (simple int)
Returns: TODO: add what function returns
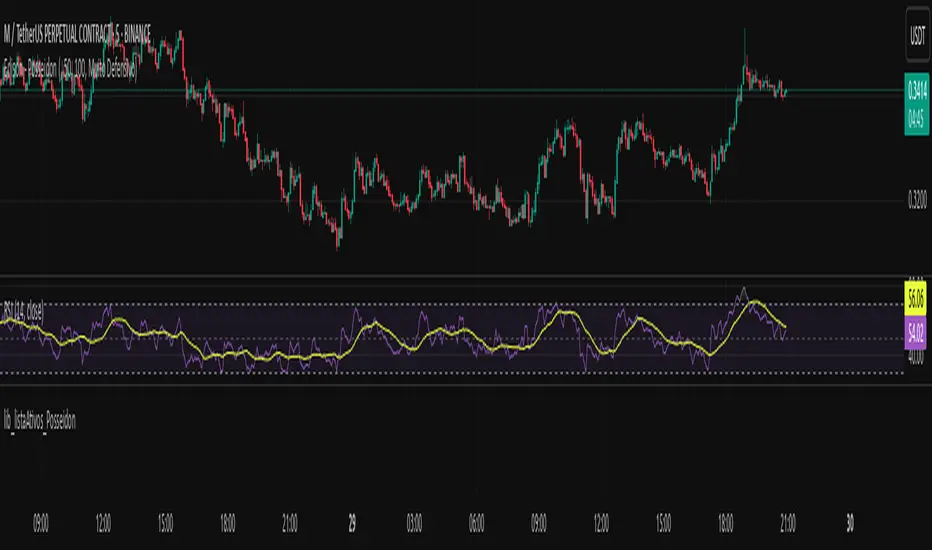
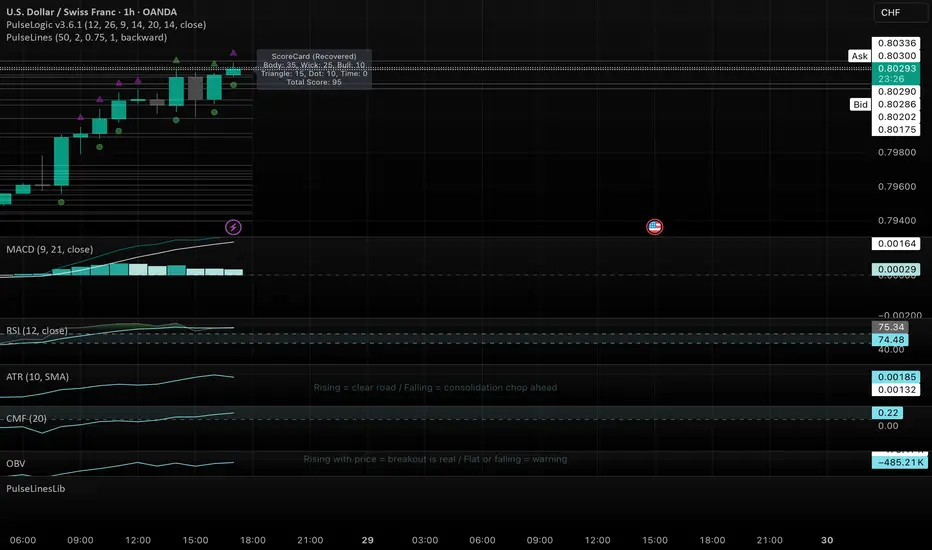
PulseLogicLibPulseLogicLib v3.6.1
PulseLogic breath-strength & momentum-structure calculator
Exports:
• getBreathScore() → int (0–100)
• hasGreenDot() → bool
• getTriangleColor() → string (“green”/“red”/“none”)
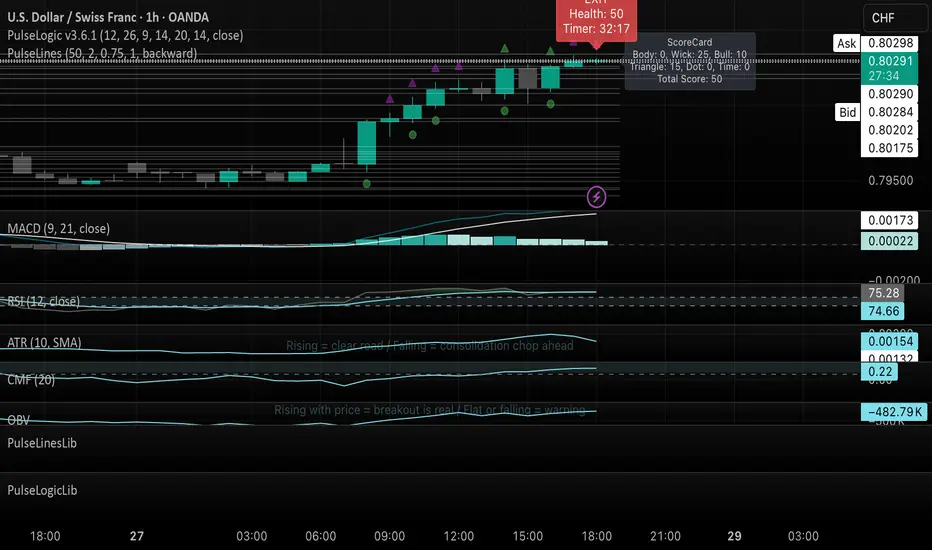
PulseLinesLibPulseLinesLib v1.3.1
PulseLines morphic-level calculator (support & resistance)
Exports:
• getLevels(lookback:int, wickRatioThresh:float, flatCandles:int, tolerancePips:float, atrMult:float) → float
hudDisplay_v1Library "hudDisplay_v1"
f_getPosition(loc)
Parameters:
loc (string)
f_getTableSize(layout, itemCount)
Parameters:
layout (string)
itemCount (int)
f_getCellPosition(layout, index)
Parameters:
layout (string)
index (int)
f_drawHUD(show, loc, layout, content, textColor, bgColor)
Parameters:
show (bool)
loc (string)
layout (string)
content (array)
textColor (color)
bgColor (color)
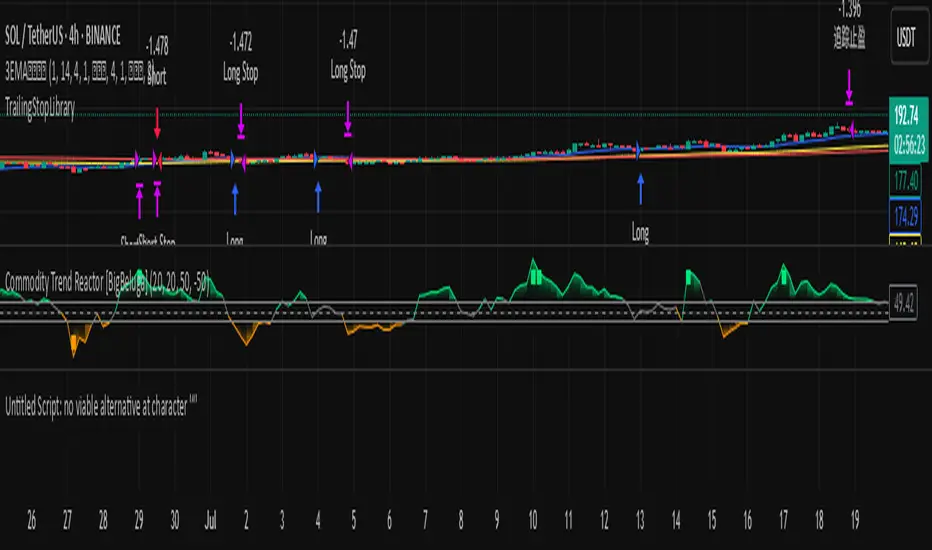
TrailingStopLibraryLibrary "TrailingStopLibrary"
专业移动止盈库 - 为Pine Script策略提供完整的追踪止盈功能。支持做多做空双向交易,基于风险回报比智能激活,提供收盘价和高低价两种判断模式。包含完整的状态管理、调试信息和易用的API接口。适用于股票、外汇、加密货币等各种市场的风险管理。
@version 1.0
@author runto2006
new_config(enabled, activation_ratio, pullback_percent, price_type)
创建移动止盈配置对象
Parameters:
enabled (bool) : (bool) 是否启用移动止盈,默认true
activation_ratio (float) : (float) 激活盈亏比,默认4.0,表示盈利4倍止损距离时激活
pullback_percent (float) : (float) 回撤百分比,默认1.0,表示回撤1%时触发止盈
price_type (string) : (string) 价格类型,默认"close"。"close"=收盘价模式,"hl"=高低价模式
Returns: Config 配置对象
new_state()
创建移动止盈状态对象
Returns: State 初始化的状态对象
reset(state)
重置移动止盈状态
Parameters:
state (State) : (State) 要重置的状态对象
Returns: void
calc_activation_target(entry_price, stop_price, activation_ratio, is_long)
计算激活目标价格
Parameters:
entry_price (float) : (float) 入场价格
stop_price (float) : (float) 止损价格
activation_ratio (float) : (float) 激活盈亏比
is_long (bool) : (bool) 是否为多头持仓
Returns: float 激活目标价格,如果输入无效则返回na
get_check_price(price_type, is_long, for_activation)
获取用于判断的价格
Parameters:
price_type (string) : (string) 价格类型:"close"或"hl"
is_long (bool) : (bool) 是否为多头持仓
for_activation (bool) : (bool) 是否用于激活判断,影响高低价的选择方向
Returns: float 当前判断价格
check_activation(config, state, entry_price, stop_price, is_long, has_position)
检查是否应该激活移动止盈
Parameters:
config (Config) : (Config) 移动止盈配置
state (State) : (State) 移动止盈状态
entry_price (float) : (float) 入场价格
stop_price (float) : (float) 止损价格
is_long (bool) : (bool) 是否为多头持仓
has_position (bool) : (bool) 是否有持仓
Returns: bool 是否成功激活
update_tracking(config, state, is_long)
更新移动止盈的追踪价格
Parameters:
config (Config) : (Config) 移动止盈配置
state (State) : (State) 移动止盈状态
is_long (bool) : (bool) 是否为多头持仓
Returns: void
check_trigger(config, state, entry_price, is_long)
检查是否触发移动止盈
Parameters:
config (Config) : (Config) 移动止盈配置
state (State) : (State) 移动止盈状态
entry_price (float) : (float) 入场价格
is_long (bool) : (bool) 是否为多头持仓
Returns: bool 是否触发止盈
process(config, state, entry_price, stop_price, is_long, has_position)
一体化处理移动止盈逻辑
Parameters:
config (Config) : (Config) 移动止盈配置
state (State) : (State) 移动止盈状态
entry_price (float) : (float) 入场价格
stop_price (float) : (float) 止损价格
is_long (bool) : (bool) 是否为多头持仓
has_position (bool) : (bool) 是否有持仓
Returns: bool 是否触发止盈
get_trigger_price(config, state, is_long)
获取当前触发价格
Parameters:
config (Config) : (Config) 移动止盈配置
state (State) : (State) 移动止盈状态
is_long (bool) : (bool) 是否为多头持仓
Returns: float 触发价格,未激活时返回na
get_pullback_percent(config, state, entry_price, is_long)
计算当前回撤百分比
Parameters:
config (Config) : (Config) 移动止盈配置
state (State) : (State) 移动止盈状态
entry_price (float) : (float) 入场价格
is_long (bool) : (bool) 是否为多头持仓
Returns: float 当前回撤百分比,未激活时返回na
get_status_info(config, state, entry_price, is_long)
获取状态信息字符串(用于调试)
Parameters:
config (Config) : (Config) 移动止盈配置
state (State) : (State) 移动止盈状态
entry_price (float) : (float) 入场价格
is_long (bool) : (bool) 是否为多头持仓
Returns: string 详细的状态信息
Config
移动止盈配置对象
Fields:
enabled (series bool) : (bool) 是否启用移动止盈功能
activation_ratio (series float) : (float) 激活盈亏比 - 盈利达到止损距离的多少倍时激活追踪
pullback_percent (series float) : (float) 回撤百分比 - 从最优价格回撤多少百分比时触发止盈
price_type (series string) : (string) 价格判断类型 - "close"使用收盘价,"hl"使用高低价
State
移动止盈状态对象
Fields:
activated (series bool) : (bool) 是否已激活追踪止盈
highest_price (series float) : (float) 激活后记录的最高价格
lowest_price (series float) : (float) 激活后记录的最低价格
activation_target (series float) : (float) 激活目标价格
MarketCapLibrary12Library "MarketCapLibrary12"
setMarketCapMap(m)
Parameters:
m (map)
getMarketCap(ticker)
Parameters:
ticker (string)
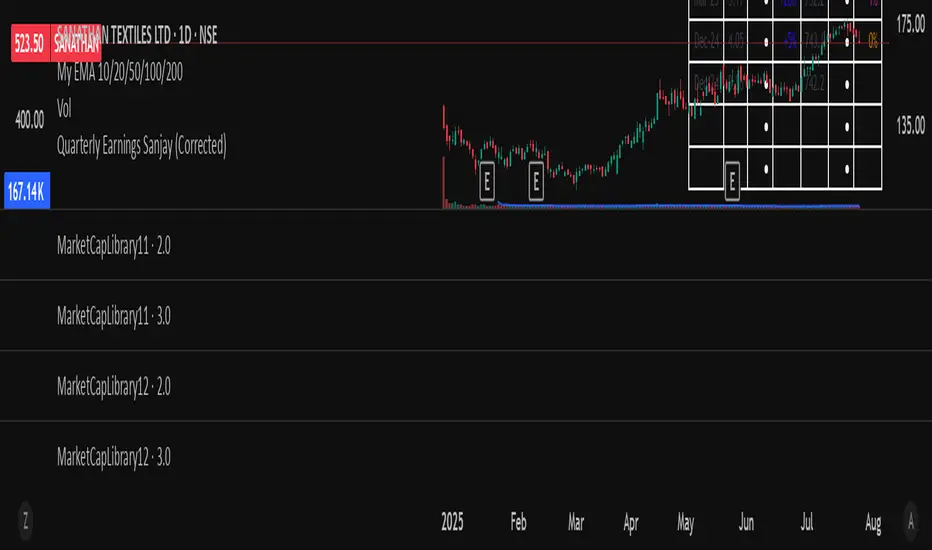
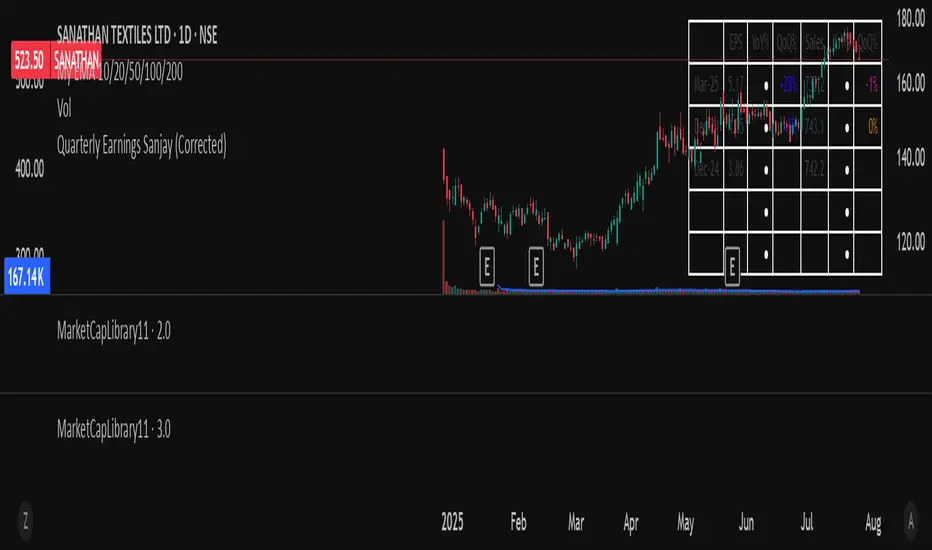
MarketCapLibrary11Library "MarketCapLibrary11"
setMarketCapMap(m)
Parameters:
m (map)
getMarketCap(ticker)
Parameters:
ticker (string)
moving_averages_library_public🔍 Overview
A comprehensive open‑source Pine Script library offering a wide variety of moving average functions, including dynamic int-series support for variable-length MA calculations
Reddit
✨ Features
Dozens of moving averages supported:
SMA, EMA, WMA, TMA
Advanced types: ALMA, VRAMA, EFRAMA, EHMA, THMA, etc.
Each function supports both fixed-length and series-length input
Easily integrated into other indicators and strategies via dynamic length parameters
⚙️ How to Use
Import the library:
import T69/Moving_Averages/1 as ma
Call your desired MA function using source and length:
ma.hma(src, len)
ma.frama(src, len)
For dynamic integration, use an input type and pass to the matching function.
🛠 Example Code
src = input.source(close, "Source")
len = input.int(14, "Length")
type = input.string("HMA", "MA Type", options= )
ma_value = switch type
"EMA" => ma.ema(src,len)
"HMA" => ma.hma(src,len)
"FRAMA" => ma.frama(src,len)
=> na
plot(ma_value, color=color.blue)
⚠️ Limitations
Internal calculation precision may differ slightly from TradingView’s built‑in MA functions
Users must manually map input strings to MA functions
Does not include built‑in GUI dropdowns for selecting type
💡 Tips
Use adaptive MAs like VIDYA, JMA, or KAMA for volatility-aware smoothing
Combine with oscillators or ATR bands to define trend strength or entry zones
Utilize series‑based MA inputs for backtesting variability or optimization
📘 Credits
Author: MightyZinger
Published: June 2022 (Public Library), regularly updated
License: Open‑source. Reuse subject to TradingView House Rules
//====================TECHNICAL STUFFS====================
Library "moving_averages_library_public"
TODO: add library description here
new_def_teyoparams()
get_all_ma_enums()
get_ma_out(p_type, src, len, update_instances)
TODO: add function description here
Parameters:
p_type (series ma_type)
src (float) : TODO: Source of the candle for computation
len (simple int) : TODO: Length of lookback of the candle for computation
update_instances (teyo_parameters)
Returns: TODO: add what function returns
==============================================================================
Moving Average Selector
==============================================================================
teyo_parameters
Fields:
p1 (series float)
p2 (series float)
p3 (series float)
p4 (series float)
p5 (series float)
p6 (series float)
p7 (series float)
p8 (series float)
p9 (series float)
p10 (series float)
p11 (series float)
p12 (series float)
p13 (series float)
p14 (series float)
p15 (series float)
p16 (series float)
p17 (series float)
p18 (series float)
p19 (series float)
p20 (series float)
