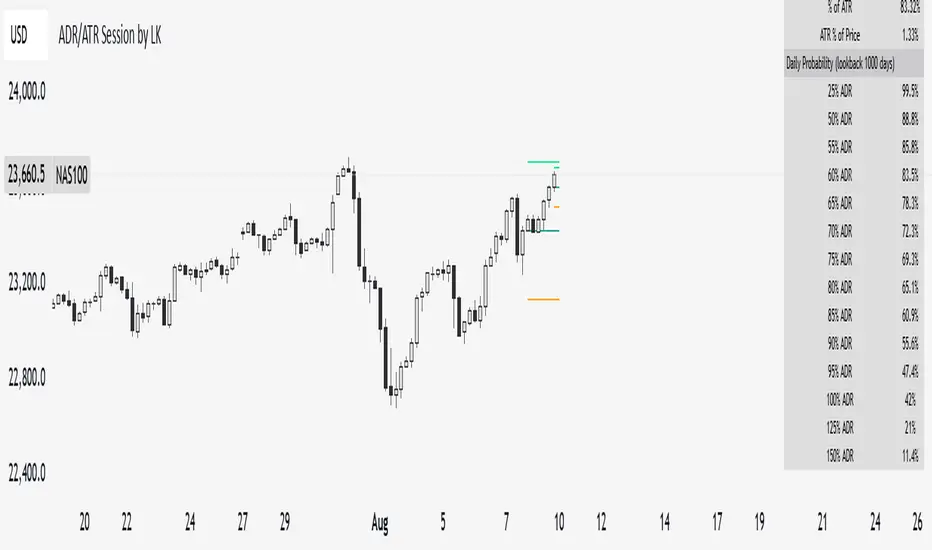
ADR/ATR Session by LK## **Features**
1. **Custom ADR & ATR Calculation**
* Calculates **Average Daily Range (ADR)** and **Average True Range (ATR)** separately for:
* **Session timeframe** (default H4 / 06:00–13:00)
* **Daily timeframe**
* Independent smoothing method selection (**SMA, EMA, RMA, WMA**) for H4 ADR, H4 ATR, Daily ADR, and Daily ATR.
2. **Percentage Metrics**
* % of ADR / ATR covered by the **current H4 bar**.
* ADR / ATR expressed as a percentage of the **current price**.
* % of ADR already reached for the **current day**.
* % of Daily ATR vs current day’s True Range.
3. **Dynamic Chart Lines**
* Draws **3 lines for H4**: Session Open, ADR High, ADR Low.
* Draws **3 lines for Daily**: Daily Open, ADR High, ADR Low.
* Lines **extend to the right** so they stay visible across the chart.
* Colors and widths are fully customizable.
4. **Real-Time Data Table**
* Compact table displaying all ADR/ATR values and percentages.
* Adjustable table font size (**tiny, small, normal, large, huge**).
* Transparent background option for minimal chart obstruction.
5. **Flexible Session Settings**
* Select session start and end time in hours/minutes.
* Choose session timezone (chart timezone or major financial centers).
* Toggle H4 lines, Daily lines separately.
6. **Lookahead Control**
* Option to wait for higher-timeframe candle close before updating values (more accurate, less repainting).
---
## **How to Use**
### **1. Adding the Indicator**
* Copy and paste the Pine Script into TradingView’s Pine Editor.
* Click **“Add to chart”**.
* Make sure your chart supports the higher timeframes you choose (e.g., H4 and Daily).
### **2. Setting Your Session**
* **Session Start Hour** & **End Hour** → Defines the intraday session to measure ADR/ATR (default: 06:00–13:00).
* **Session Timezone** → Pick “Chart” or a major financial center (e.g., New York, London, Tokyo).
### **3. Choosing Smoothing Methods**
* For each ADR/ATR (H4 and Daily), choose:
* SMA (Simple)
* EMA (Exponential)
* RMA (Wilder’s smoothing)
* WMA (Weighted)
### **4. Adjusting Chart Display**
* **Show H4 Lines** → Displays session open and ADR High/Low for the current H4 session.
* **Show Daily Lines** → Displays daily open and ADR High/Low.
* Customize line colors and widths.
### **5. Reading the Table**
* **H4 Section**
* ADR / ATR values for the selected session.
* % of ADR/ATR covered by the **current H4 bar**.
* ADR/ATR as % of the current price.
* **Daily Section**
* ADR / ATR for the daily timeframe.
* % of ADR already covered by today’s range.
* ADR/ATR as % of price.
### **6. Pro Tips**
* Use **H4 ADR %** to gauge intraday exhaustion — if current range is near 100%, market may slow or reverse.
* Use **Daily ADR %** for swing trade context — if a day has moved beyond its ADR, expect lower continuation probability.
* Combine with support/resistance to identify high-probability reversal zones.
Indicators and strategies
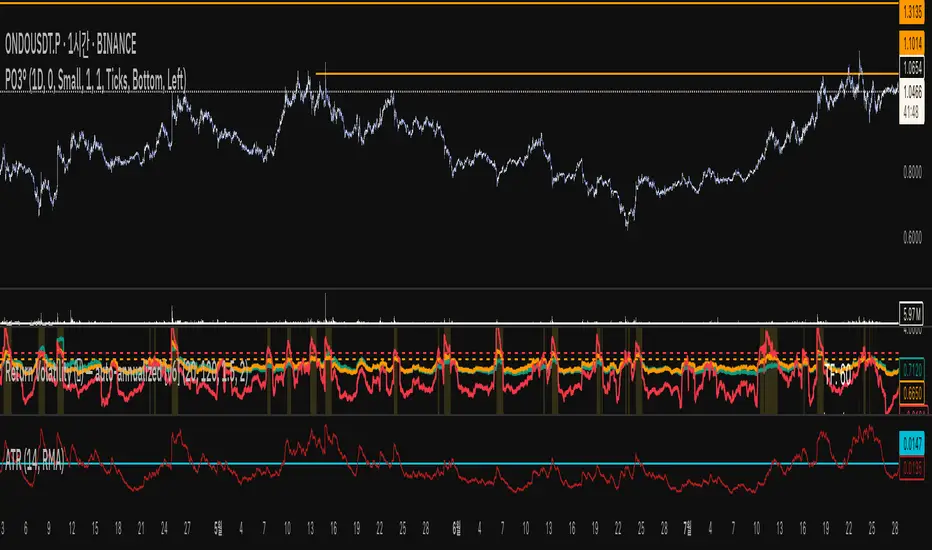
Return Volatility (σ) — auto-annualized [v6]Overview
This indicator calculates and visualizes the return-based volatility (standard deviation) of any asset, automatically adjusting for your chart's timeframe to provide both absolute and annualized volatility values.
It’s designed for traders who want to filter trades, adjust position sizing, and detect volatility events based on statistically significant changes in market activity.
Key Features
Absolute Volatility (abs σ%) – Standard deviation of returns for the current timeframe (e.g., 1H, 4H, 1D).
Annualized Volatility (ann σ%) – Converts abs σ% into an annualized figure for easier cross-timeframe and cross-asset comparison.
Relative Volatility (rel σ) – Ratio of current volatility to the long-term average (default: 120 periods).
Z-Score – Number of standard deviations the current volatility is above or below its historical average.
Auto-Timeframe Adjustment – Detects your chart’s bar size (seconds per bar) and calculates bars/year automatically for crypto’s 24/7 market.
Highlight Mode – Optional yellow background when volatility exceeds set thresholds (rel σ ≥ threshold OR z-score ≥ threshold).
Alert Conditions – Alerts trigger when relative volatility or z-score exceed defined limits.
How It Works
Return Calculation
Log returns: ln(Pt / Pt-1) (default)
or Simple returns: (Pt / Pt-1) – 1
Volatility Measurement
Standard deviation of returns over the lookback period N (default: 20 bars).
Absolute volatility = σ × 100 (% per bar).
Annualization
Uses: σₐₙₙ = σ × √(bars/year) × 100 (%)
Bars/year auto-calculated based on timeframe:
1H = 8,760 bars/year
4H ≈ 2,190 bars/year
1D = 365 bars/year
Relative and Statistical Context
Relative σ = Current σ / Historical average σ (baseLen, default: 120)
Z-score = (Current σ – Historical average σ) / Std. dev. of σ over baseLen
Trading Applications
Volatility Filter – Only allow trade entries when volatility exceeds historical norms (trend traders often benefit from this).
Risk Management – Reduce position size during high volatility spikes to manage risk; increase size in low-volatility trending environments.
Market Scanning – Identify assets with the highest relative volatility for momentum or breakout strategies.
Event Detection – Highlight significant volatility surges that may precede large moves.
Suggested Settings
Lookback (N): 20 bars for short/medium-term trading.
Base Length (M): 120 bars to establish long-term volatility baseline.
Relative Threshold: 1.5× baseline σ.
Z-score Threshold: ≥ 2.0 for statistically significant volatility shifts.
Use Log Returns: Recommended for more consistent scaling across prices.
Notes & Limitations
Volatility measures movement magnitude, not direction. Combine with trend or momentum filters for directional bias.
Very low volatility may still produce false breakouts; combine with volume and market structure analysis.
Crypto markets trade 24/7 — annualization assumes no market closures; adjust for other asset classes if needed.
💡 Best Practice: Use this indicator as a pre-trade filter for breakout or trend-following strategies, or as a risk control overlay in mean-reversion systems.
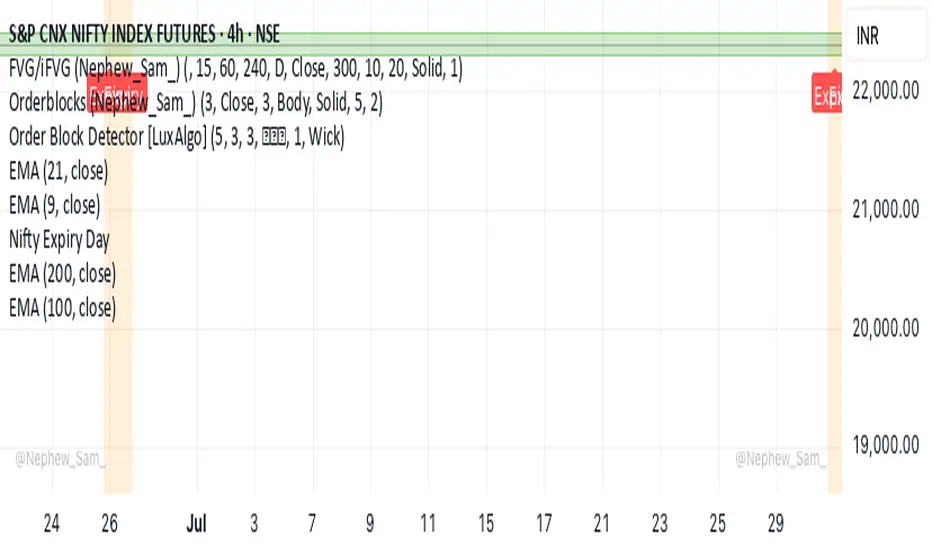
Nifty Futures Monthly ExpiryThis script helps in identifying Nifty Expiry Day, which is last Thursday of every month.
This indicator can be added to Nifty Futures only.
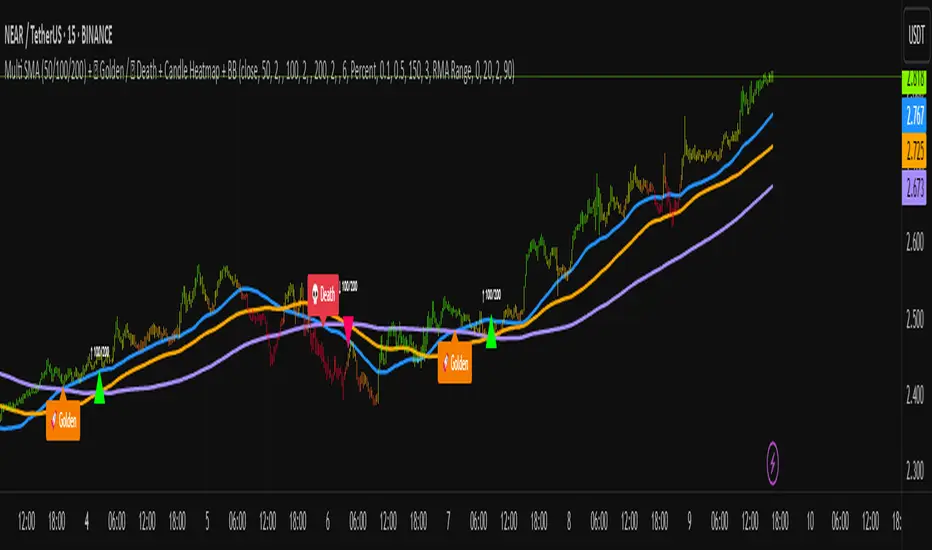
Multi SMA + Golden/Death + Heatmap + BB**Multi SMA (50/100/200) + Golden/Death + Candle Heatmap + BB**
A practical trend toolkit that blends classic 50/100/200 SMAs with clear crossover labels, special 🚀 Golden / 💀 Death Cross markers, and a readable candle heatmap based on a dynamic regression midline and volatility bands. Optional Bollinger Bands are included for context.
* See trend direction at a glance with SMAs.
* Get minimal, de-cluttered labels on important crosses (50↔100, 50↔200, 100↔200).
* Highlight big regime shifts with special Golden/Death tags.
* Read momentum and volatility with the candle heatmap.
* Add Bollinger Bands if you want classic mean-reversion context.
Designed to be lightweight, non-repainting on confirmed bars, and flexible across timeframes.
# What This Indicator Does (plain English)
* **Tracks trend** using **SMA 50/100/200** and lets you optionally compute each SMA on a higher or different timeframe (HTF-safe, no lookahead).
* **Prints labels** when SMAs cross each other (up or down). You can force signals only after bar close to avoid repaint.
* **Marks Golden/Death Crosses** (50 over/under 200) with special labels so major regime changes stand out.
* **Colors candles** with a **heatmap** built from a regression midline and volatility bands—greenish above, reddish below, with a smooth gradient.
* **Optionally shows Bollinger Bands** (basis SMA + stdev bands) and fills the area between them.
* **Includes alert conditions** for Golden and Death Cross so you can automate notifications.
---
# Settings — Simple Explanations
## Source
* **Source**: Price source used to calculate SMAs and Bollinger basis. Default: `close`.
## SMA 50
* **Show 50**: Turn the SMA(50) line on/off.
* **Length 50**: How many bars to average. Lower = faster but noisier.
* **Color 50** / **Width 50**: Visual style.
* **Timeframe 50**: Optional alternate timeframe for SMA(50). Leave empty to use the chart timeframe.
## SMA 100
* **Show 100**: Turn the SMA(100) line on/off.
* **Length 100**: Bars used for the mid-term trend.
* **Color 100** / **Width 100**: Visual style.
* **Timeframe 100**: Optional alternate timeframe for SMA(100).
## SMA 200
* **Show 200**: Turn the SMA(200) line on/off.
* **Length 200**: Bars used for the long-term trend.
* **Color 200** / **Width 200**: Visual style.
* **Timeframe 200**: Optional alternate timeframe for SMA(200).
## Signals (crossover labels)
* **Show crossover signals**: Prints triangle labels on SMA crosses (50↔100, 50↔200, 100↔200).
* **Wait for bar close (confirmed)**: If ON, signals only appear after the candle closes (reduces repaint).
* **Min bars between same-pair signals**: Minimum spacing to avoid duplicate labels from the same SMA pair too often.
* **Trend filter (buy: 50>100>200, sell: 50<100<200)**: Only show bullish labels when SMAs are stacked bullish (50 above 100 above 200), and only show bearish labels when stacked bearish.
### Label Offset
* **Offset mode**: Choose how to push labels away from price:
* **Percent**: Offset is a % of price.
* **ATR x**: Offset is ATR(14) × multiplier.
* **Percent of price (%)**: Used when mode = Percent.
* **ATR multiplier (for ‘ATR x’)**: Used when mode = ATR x.
### Label Colors
* **Bull color** / **Bear color**: Background of triangle labels.
* **Bull label text color** / **Bear label text color**: Text color inside the triangles.
## Golden / Death Cross
* **Show 🚀 Golden Cross (50↑200)**: Show a special “Golden” label when SMA50 crosses above SMA200.
* **Golden label color** / **Golden text color**: Styling for Golden label.
* **Show 💀 Death Cross (50↓200)**: Show a special “Death” label when SMA50 crosses below SMA200.
* **Death label color** / **Death text color**: Styling for Death label.
## Candle Heatmap
* **Enable heatmap candle colors**: Turns the heatmap on/off.
* **Length**: Lookback for the regression midline and volatility measure.
* **Deviation Multiplier**: Band width around the midline (bigger = wider).
* **Volatility basis**:
* **RMA Range** (smoothed high-low range)
* **Stdev** (standard deviation of close)
* **Upper/Middle/Lower color**: Gradient colors for the heatmap.
* **Heatmap transparency (0..100)**: 0 = solid, 100 = invisible.
* **Force override base candles**: Repaint base candles so heatmap stays visible even if your chart has custom coloring.
## Bollinger Bands (optional)
* **Show Bollinger Bands**: Toggle the overlay on/off.
* **Length**: Basis SMA length.
* **StdDev Multiplier**: Distance of bands from the basis in standard deviations.
* **Basis color** / **Band color**: Line colors for basis and bands.
* **Bands fill transparency**: Opacity of the fill between upper/lower bands.
---
# Features & How It Works
## 1) HTF-Safe SMAs
Each SMA can be calculated on the chart timeframe or a higher/different timeframe you choose. The script pulls HTF values **without lookahead** (non-repainting on confirmed bars).
## 2) Crossover Labels (Three Pairs)
* **50↔100**, **50↔200**, **100↔200**:
* **Triangle Up** label when the first SMA crosses **above** the second.
* **Triangle Down** label when it crosses **below**.
* Optional **Trend Filter** ensures only signals aligned with the overall stack (50>100>200 for bullish, 50<100<200 for bearish).
* **Debounce** spacing avoids repeated labels for the same pair too close together.
## 3) Golden / Death Cross Highlights
* **🚀 Golden Cross**: SMA50 crosses **above** SMA200 (often a longer-term bullish regime shift).
* **💀 Death Cross**: SMA50 crosses **below** SMA200 (often a longer-term bearish regime shift).
* Separate styling so they stand out from regular cross labels.
## 4) Candle Heatmap
* Builds a **regression midline** with **volatility bands**; colors candles by their position inside that channel.
* Smooth gradient: lower side → reddish, mid → yellowish, upper side → greenish.
* Helps you see momentum and “where price sits” relative to a dynamic channel.
## 5) Bollinger Bands (Optional)
* Classic **basis SMA** ± **StdDev** bands.
* Light visual context for mean-reversion and volatility expansion.
## 6) Alerts
* **Golden Cross**: `🚀 GOLDEN CROSS: SMA 50 crossed ABOVE SMA 200`
* **Death Cross**: `💀 DEATH CROSS: SMA 50 crossed BELOW SMA 200`
Add these to your alerts to get notified automatically.
---
# Tips & Notes
* For fewer false positives, keep **“Wait for bar close”** ON, especially on lower timeframes.
* Use the **Trend Filter** to align signals with the broader stack and cut noise.
* For HTF context, set **Timeframe 50/100/200** to higher frames (e.g., H1/H4/D) while you trade on a lower frame.
* Heatmap “Length” and “Deviation Multiplier” control smoothness and channel width—tune for your asset’s volatility.
Trend Bandsmovig averages of 4 bands to calculate roughly if if prices are moving up or down in a given time frame, though it is a lagging indicator
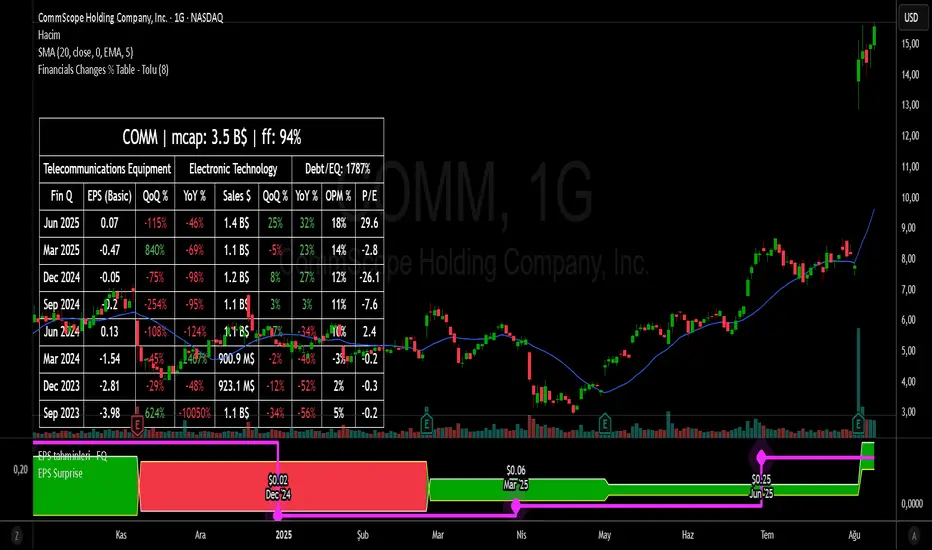
Financial Change % Table - ToluFinancial Change % Table which includes revenue , operating profit and earning per share . compares the financial data with previous quarter QoQ and previous year YoY . and shows the change in %.
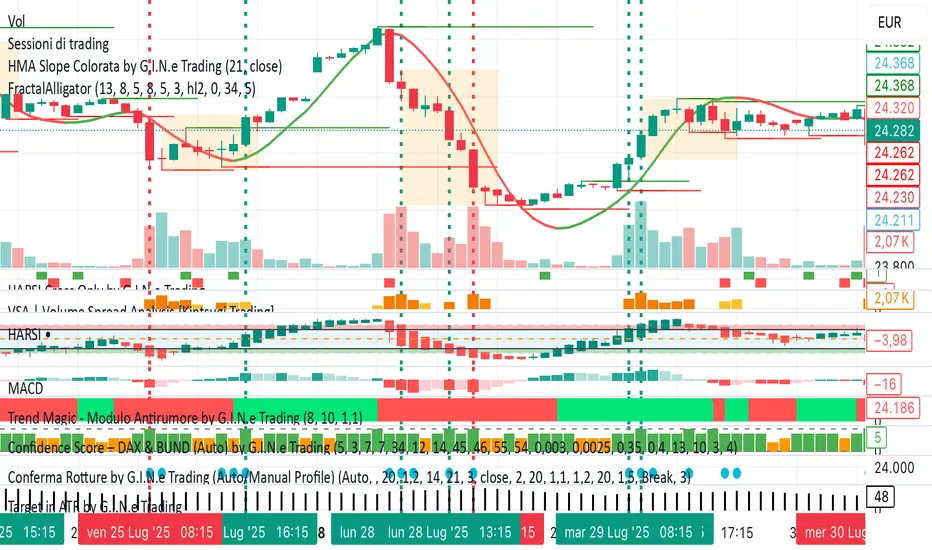
Conferma Rotture by G.I.N.e Trading (Auto/Manual Profile)This indicator is designed to detect Range Expansion Bars (REB) and validate them through multiple filters, including trend alignment, fractal breakouts, volume strength, and VSA logic.
It can be used as a standalone breakout detector or as a confirmation tool for existing strategies.
Main Components
Range Expansion Detection (REB)
A bar is considered a REB when its range (High − Low) exceeds a dynamic threshold based on either:
Average range over N bars, or
ATR over N bars (if enabled).
Thresholds are adjustable and can adapt automatically to the instrument (e.g., DAX, Bund).
Trend Filter — HMA Slope
Calculates the slope of a Hull Moving Average to determine trend direction.
REB signals are only valid when aligned with the current trend (optional filter).
Fractal Breakout Confirmation
Uses Bill Williams fractals to identify the most recent swing high/low.
A REB is confirmed only if it breaks the latest fractal in the signal’s direction (optional).
Volume Filters
Simple Volume Check: Volume must be greater than the moving average × multiplier.
VSA Filter: Requires wide spread + high volume, confirming strong participation.
Armed Trigger Mode (Two-step Confirmation)
Step 1: REB detected → state is “armed” for a set number of bars.
Step 2: Position triggers only if price breaks the REB bar’s high/low within the validity window.
Visual Elements
Green/Red Columns — Confirmed REB signals (Long / Short).
White Line — REB intensity (range / base).
Yellow ±0.5 Line — “Armed” state before trigger activation.
Aqua Circles — VSA confirmation (wide spread + high volume).
Teal Line — Last up fractal level.
Orange Line — Last down fractal level.
Usage Example
Detect breakouts with strong momentum and volume.
Combine with fractal breakout for additional confirmation.
Use in “armed” mode to avoid false entries and require a follow-up trigger.
Especially suited for futures like DAX and Bund, but parameters can be adapted to other assets.
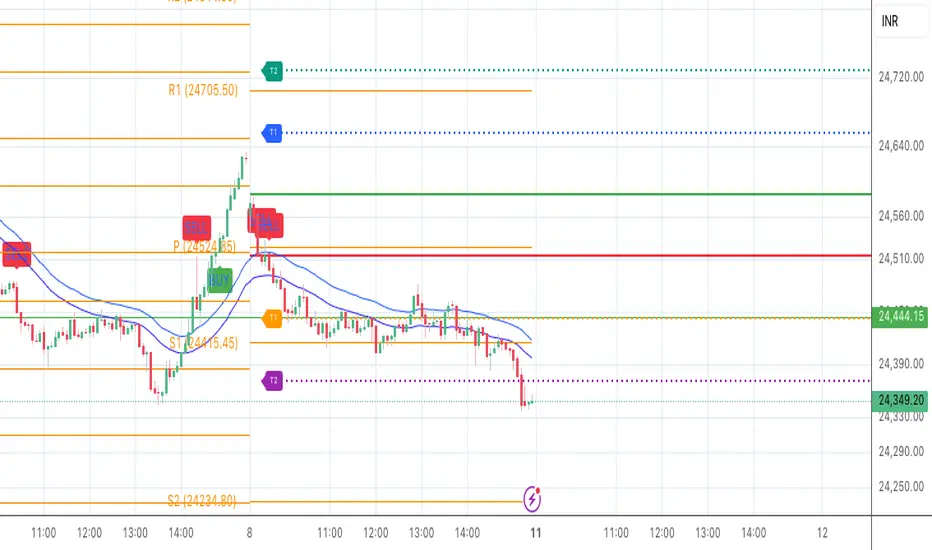
Opening Range BreakoutThis indicator is designed for Opening Range Breakout (ORB) traders who want automatic calculation of breakout levels and multiple price targets.
It is optimised for NSE intraday trading, capturing the first 15-minute range from 09:15 to 09:30 and plotting key breakout targets for both long and short trades.
✨ Features:
Automatic daily reset — fresh levels are calculated every trading day.
Opening Range High & Low plotted immediately after 09:30.
Two profit targets for both Buy & Sell breakouts based on the opening range size:
T1 = 100% of range added/subtracted from OR high/low.
T2 = 200% of range added/subtracted from OR high/low.
Clear breakout signals (BUY / SELL labels) when price crosses the OR High or Low.
Custom alerts for both buy and sell triggers.
Designed to work on any intraday timeframe (1min, 3min, 5min, etc.).
📊 How it works:
From 09:15 to 09:30, the script records the highest and lowest prices.
At 09:30, the range is locked in and breakout targets are calculated automatically.
Buy and Sell signals are generated when price breaks above the OR High or below the OR Low.
Targets and range lines automatically reset for the next day.
⚠️ Notes:
This script is tuned for NSE market timings but can be adapted for other markets by changing the session input.
Works best on intraday charts for active traders.
This is not financial advice — always backtest before trading live.
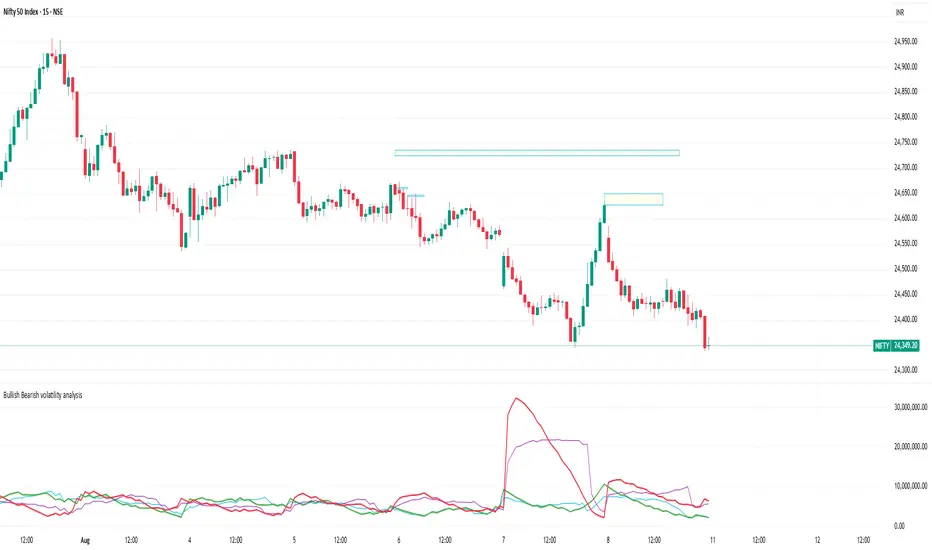
Bullish Bearish volatility analysisThis script is used to analyse Bullish/Bearish volatility direction based on volumes and moving average.
xmtr's session highs/lowsMarks Asia & London session highs/lows with precision + PDH/PDL for daily context. Fully customizable & perfect for all traders.
MACD (Panel) with Histogram-Confirmed Signals - Middle LineMacd indicator with buy and sell signals to help spot the macd signal crossover and histogram
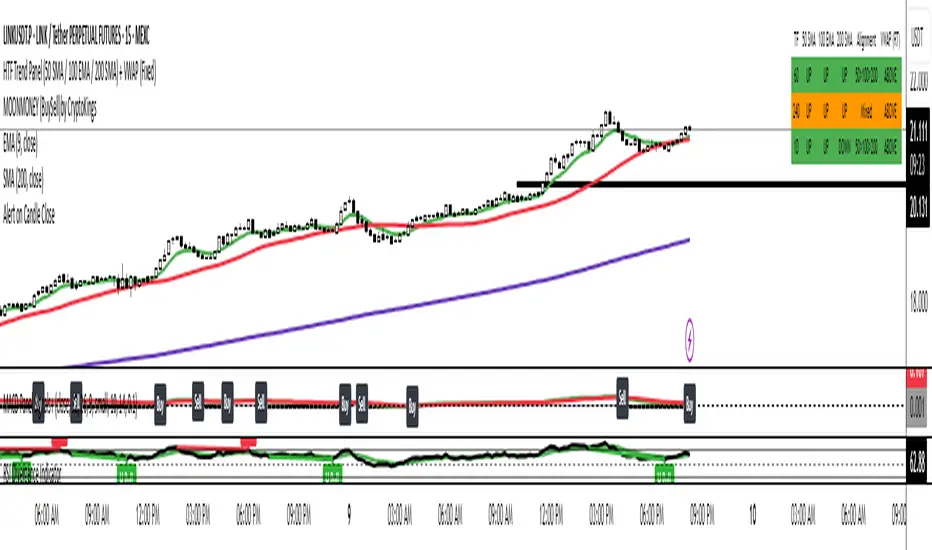
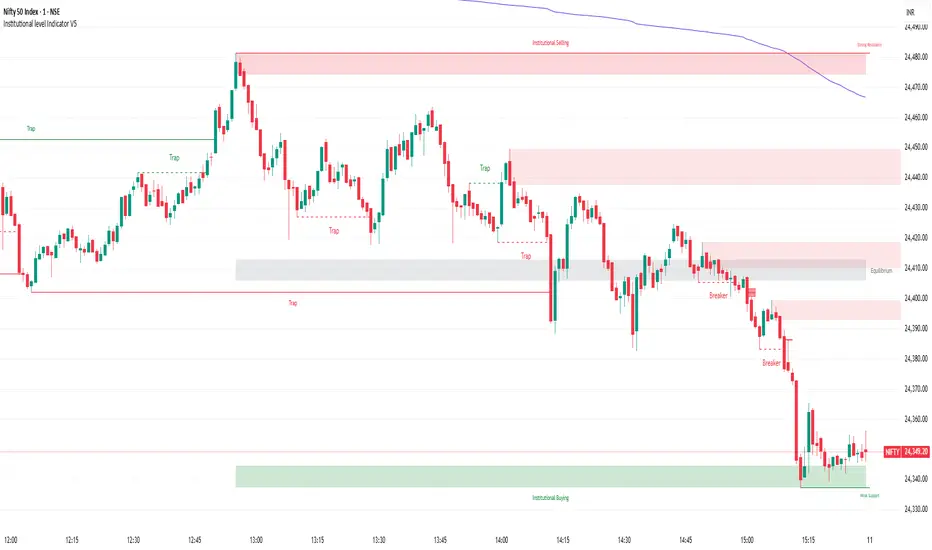
Institutional level Indicator V5Smart money concept indicator with added VWAP for better understanding for fair price with relation to movement of price.
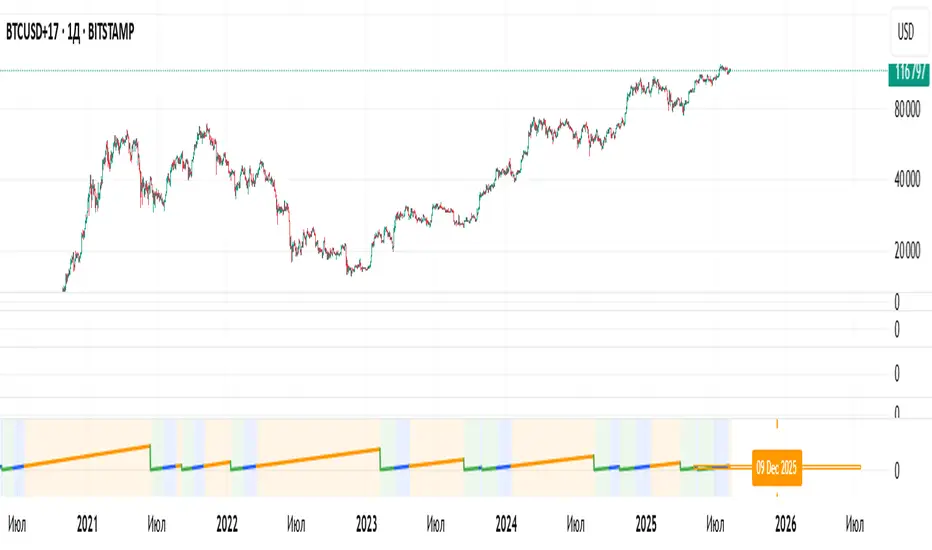
Cycle Phase & ETA Tracker [Robust v4]
Cycle Phase & ETA Tracker
Description
The Cycle Phase & ETA Tracker is a powerful tool for analyzing market cycles and predicting the completion of the current cycle (Estimated Time of Arrival, or ETA). It visualizes the cycle phase (0–100%) using a smoothed signal and displays the forecasted completion date with an optional confidence band based on cycle length variability. Ideal for traders looking to time their trades based on cyclical patterns, this indicator offers flexible settings for robust cycle analysis.
Key Features
Cycle Phase Visualization: Tracks the current cycle phase (0–100%) with color-coded zones: green (0–33%), blue (33–66%), orange (66–100%).
ETA Forecast: Shows a vertical line and label indicating the estimated date of cycle completion.
Confidence Band (±σ): Displays a band around the ETA to reflect uncertainty, calculated using the standard deviation of cycle lengths.
Multiple Averaging Methods: Choose from three methods to calculate average cycle length:
Median (Robust): Uses the median for resilience against outliers.
Weighted Mean: Prioritizes recent cycles with linear or quadratic weights.
Simple Mean: Applies equal weights to all cycles.
Adaptive Cycle Length: Automatically adjusts cycle length based on the timeframe or allows a fixed length.
Debug Histogram: Optionally displays the smoothed signal for diagnostic purposes.
Setup and Usage
Add the Indicator:
Search for "Cycle Phase & ETA Tracker " in TradingView’s indicator library and apply it to your chart.
Configure Parameters:
Core Settings:
Track Last N Cycles: Sets the number of recent cycles used to calculate the average cycle length (default: 20). Higher values provide stability but may lag market shifts.
Source: Selects the data source for analysis (e.g., close, open, high; default: close price).
Use Adaptive Cycle Length?: Enables automatic cycle length adjustment based on timeframe (e.g., shorter for intraday, longer for daily) or uses a fixed length if disabled.
Fixed Cycle Length: Defines the cycle length in bars when adaptive mode is off (default: 14). Smaller values increase sensitivity to short-term cycles.
Show Debug Histogram: Enables a histogram of the smoothed signal for debugging signal behavior.
Cycle Length Estimation:
Average Mode: Selects the method for calculating average cycle length: "Median (Robust)", "Weighted Mean", or "Simple Mean".
Weights (for Weighted Mean): For "Weighted Mean", chooses "linear" (moderate emphasis on recent cycles) or "quadratic" (strong emphasis on recent cycles).
ETA Visualization:
Show ETA Line & Label: Toggles the display of the ETA line and date label.
Show ETA Confidence Band (±σ): Toggles the confidence band around the ETA, showing the uncertainty range.
Band Transparency: Adjusts the transparency of the confidence band (0 = fully transparent, 100 = fully opaque; default: 85).
ETA Color: Sets the color for the ETA line, label, and confidence band (default: orange).
Interpretation:
The cycle phase (0–100%) indicates progress: green for the start, blue for the middle, and orange for the end of the cycle.
The ETA line and label show the predicted cycle completion date.
The confidence band reflects the uncertainty range (±1 standard deviation) of the ETA.
If a warning "Insufficient cycles for ETA" appears, wait for the indicator to collect at least 3 cycles.
Limitations
Requires at least 3 cycles for reliable ETA and confidence band calculations.
On low timeframes or low-volatility markets, zero-crossings may be infrequent, delaying ETA updates.
Accuracy depends on proper cycle length settings (adaptive or fixed).
Notes
Test the indicator across different assets and timeframes to optimize settings.
Use the debug histogram to troubleshoot if the ETA appears inaccurate.
For feedback or suggestions, contact the author via TradingView.
Cycle Phase & ETA Tracker
Описание
Индикатор Cycle Phase & ETA Tracker предназначен для анализа рыночных циклов и прогнозирования времени завершения текущего цикла (ETA — Estimated Time of Arrival). Он отслеживает фазы цикла (0–100%) на основе сглаженного сигнала и отображает предполагаемую дату завершения цикла с опциональной доверительной полосой, основанной на стандартном отклонении длин циклов. Индикатор идеально подходит для трейдеров, которые хотят выявлять циклические закономерности и планировать свои действия на основе прогнозируемого времени.
Ключевые особенности
Фазы цикла: Визуализирует текущую фазу цикла (0–100%) с цветовой кодировкой: зеленый (0–33%), синий (33–66%), оранжевый (66–100%).
Прогноз ETA: Показывает вертикальную линию и метку с предполагаемой датой завершения цикла.
Доверительная полоса (±σ): Отображает зону неопределенности вокруг ETA, основанную на стандартном отклонении длин циклов.
Гибкие методы усреднения: Поддерживает три метода расчета средней длины цикла:
Median (Robust): Медиана, устойчивая к выбросам.
Weighted Mean: Взвешенное среднее, где недавние циклы имеют больший вес (линейный или квадратичный).
Simple Mean: Простое среднее с равными весами.
Адаптивная длина цикла: Автоматически подстраивает длину цикла под таймфрейм или позволяет задать фиксированную длину.
Отладочная гистограмма: Опционально отображает сглаженный сигнал для анализа.
Настройка и использование
Добавьте индикатор:
Найдите "Cycle Phase & ETA Tracker " в библиотеке индикаторов TradingView и добавьте его на график.
Настройте параметры:
Core Settings:
Track Last N Cycles: Количество последних циклов для расчета средней длины (по умолчанию 20). Большие значения дают более стабильные результаты, но могут запаздывать.
Source: Источник данных (по умолчанию цена закрытия).
Use Adaptive Cycle Length?: Включите для автоматической настройки длины цикла по таймфрейму или отключите для использования фиксированной длины.
Fixed Cycle Length: Длина цикла в барах, если адаптивная длина отключена (по умолчанию 14).
Show Debug Histogram: Включите для отображения сглаженного сигнала (полезно для отладки).
Cycle Length Estimation:
Average Mode: Выберите метод усреднения: "Median (Robust)", "Weighted Mean" или "Simple Mean".
Weights (for Weighted Mean): Для режима "Weighted Mean" выберите "linear" (умеренный вес для новых циклов) или "quadratic" (сильный вес для новых циклов).
ETA Visualization:
Show ETA Line & Label: Включите для отображения линии и метки ETA.
Show ETA Confidence Band (±σ): Включите для отображения доверительной полосы.
Band Transparency: Прозрачность полосы (0 — полностью прозрачная, 100 — полностью непрозрачная, по умолчанию 85).
ETA Color: Цвет для линии, метки и полосы (по умолчанию оранжевый).
Интерпретация:
Фаза цикла (0–100%) показывает прогресс текущего цикла: зеленый — начало, синий — середина, оранжевый — конец.
Линия и метка ETA указывают предполагаемую дату завершения цикла.
Доверительная полоса показывает диапазон неопределенности (±1 стандартное отклонение).
Если отображается предупреждение "Insufficient cycles for ETA", дождитесь, пока индикатор соберет минимум 3 цикла.
Ограничения
Требуется минимум 3 цикла для надежного расчета ETA и доверительной полосы.
На низких таймфреймах или рынках с низкой волатильностью пересечения нуля могут быть редкими, что замедляет обновление ETA.
Эффективность зависит от правильной настройки длины цикла (fixedL или адаптивной).
Примечания
Протестируйте индикатор на разных таймфреймах и активах, чтобы подобрать оптимальные параметры.
Используйте отладочную гистограмму для анализа сигнала, если ETA кажется неточным.
Для вопросов или предложений по улучшению свяжитесь через TradingView.
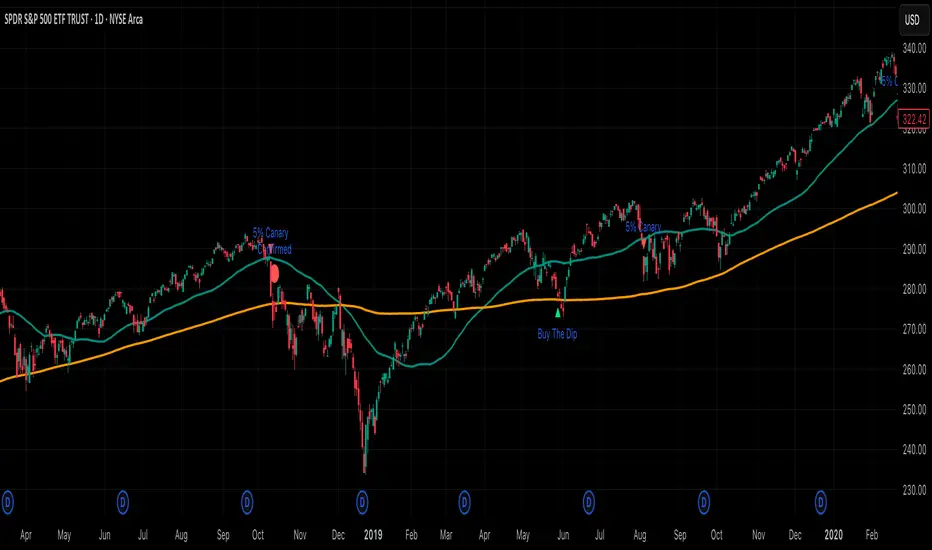
5% Canary (per Thrasher) Implements Thrasher’s framework using closing prices and simple, non-optimized thresholds. The study watches for the first 5% decline from the latest 52-week closing high and classifies it:
• 5% Canary: drop occurs in ≤ 15 trading days.
• Confirmed 5% Canary: within 42 trading days of a Canary, there are two consecutive closes below the 200-DMA.
• Buy-the-Dip: the first 5% decline takes > 15 days and 50-DMA > 200-DMA (uptrend).
Includes optional 50/200-DMA plots, clutter-reduction, and alert conditions. This is a signal framework, not a standalone system—pair with your own risk management.
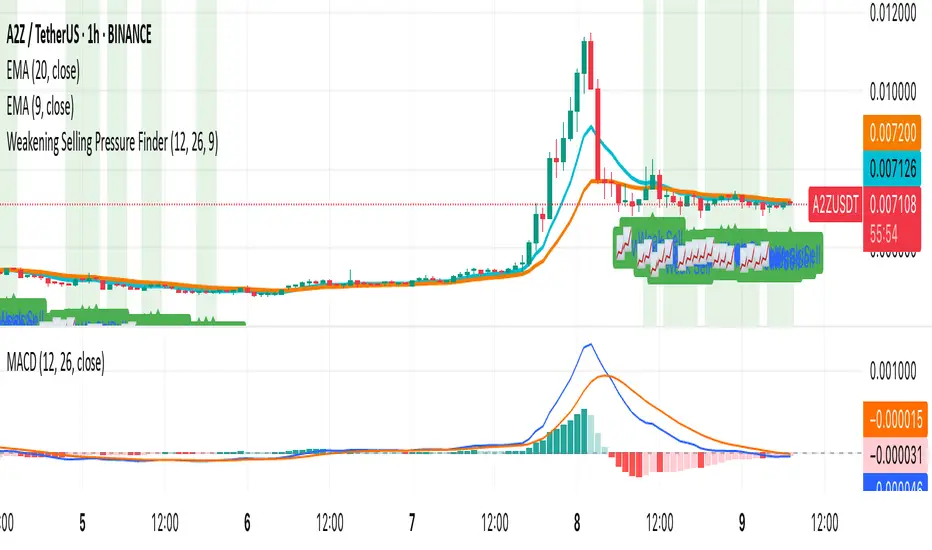
Weakening Selling Pressure FinderDescription:
This indicator helps traders identify potential trend reversals by detecting when selling pressure is weakening.
It uses the MACD histogram to spot moments when bearish momentum is still present but fading — a condition that often precedes a shift to bullish sentiment.
The indicator:
Highlights points where the MACD histogram is negative but rising
Marks these spots with a 📈 label for easy chart scanning
Works on any crypto pair and timeframe
Traders can use it to:
Spot early reversal setups before the crowd reacts
Time entries for potential trend changes
Complement other indicators like RSI, AO, or price action
This is a momentum shift detection tool — perfect for swing traders, scalpers, or anyone looking for early bullish signals after extended selling pressure.
BarCounter_Q主要是用来计算日内5分钟级别的k线数量
"Primarily used to calculate the number of intraday 5-minute candlestick charts."
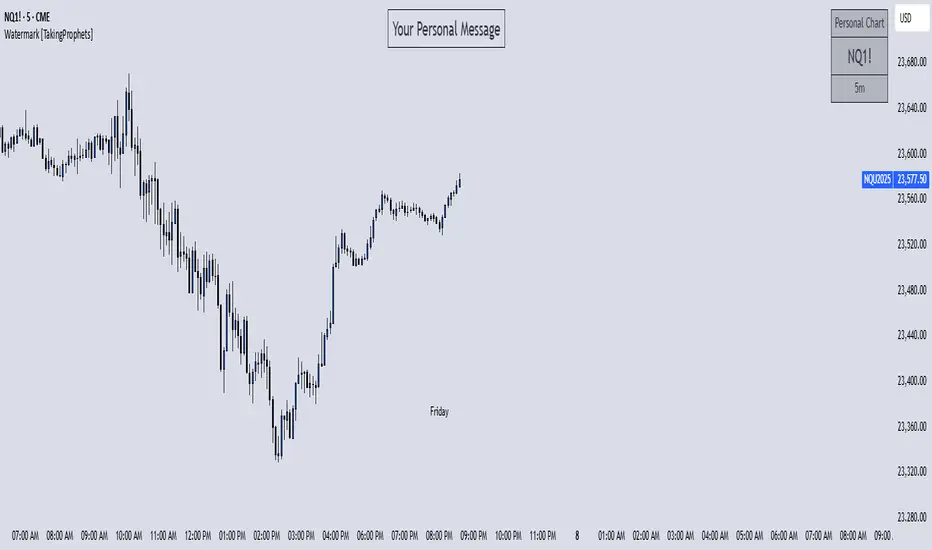
Watermark [TakingProphets] Watermark
A fully customizable watermark & chart info panel to keep your charts branded, organized, and informative — without clutter.
Special thanks to for inspiring the original concept that led to this expanded version.
📌 Overview
Perfect for:
Traders who stream, record, or share charts
Keeping essential info (symbol, TF, date, price) visible
Intraday traders who want day-of-week labels without messy vertical lines
✨ Key Features
1. Personal Watermark
Custom text, colors, size, opacity
Position anywhere: Top, Middle, Bottom × Left, Center, Right
Alignment options: left, center, right
Optional border with adjustable color or hide completely
2. Chart Info Panel
Show any combination of:
Custom text
Symbol
Timeframe (auto-formatted)
Date (MM-DD-YYYY)
Last price
Day of the week
Position independently from watermark
Adjustable background opacity
3. Day-of-Week Labels
Labels Sunday → Saturday at session start or midday
Works on intraday ≤ 15m timeframes
Option to hide weekends
Place labels Top or Bottom
⚙️ How to Use
Enable Watermark → Personal Watermark Settings → Toggle Show Watermark, enter your text, style it.
Set Up Info Panel → Chart Information Panel → Select details, choose position, adjust style.
Add Day Labels → Day of Week Labels Settings → Turn on for intraday charts.
💡 Tips
Lower background opacity for a subtle look.
Use bright colors for streaming so your brand stands out.
Hide unused features to keep charts clean & fast.
🙏 Acknowledgments
This script’s concept was inspired by toodegrees.
Developed by TakingProphets — tools for traders who value clarity, precision, and style.
⚠️ Disclaimer:
This script is for informational purposes only. It is not financial advice. Always trade responsibly and manage your risk.
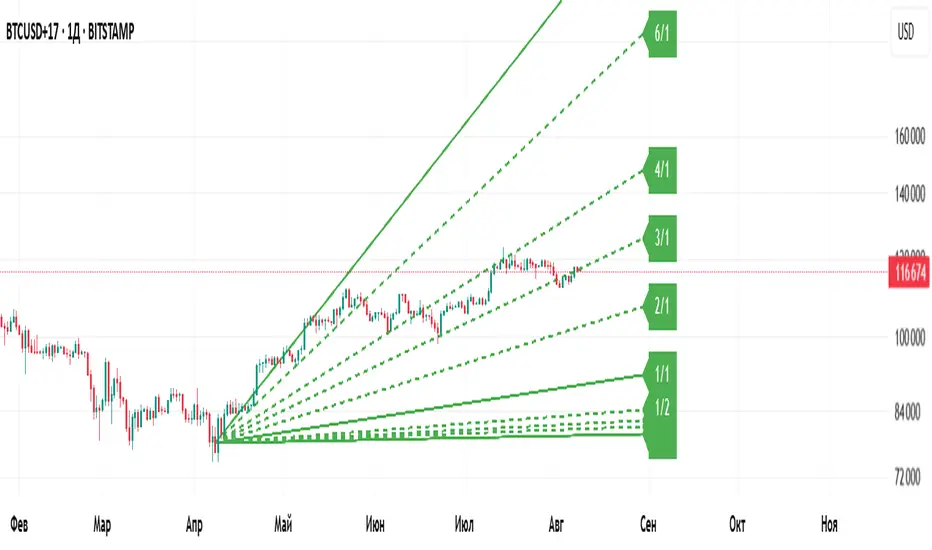
Gann Fan Master – Selectable Base Angle & Fibonacci AnglesGann Fan Master – Selectable Base Angle & Fibonacci Angles
This indicator plots a Gann Fan from point A1 through point B1, with full customization over:
Base angle selection (8/1, 1/1, 1/8)
Main angle set
Fibonacci-based angles
Up to 10 custom user-defined angles
Logarithmic or linear slope calculation
Custom fan color and extended line length
Perfect for manual chart analysis — you select A1 and B1, the script calculates and draws the fan with labeled angles.
How It Works
-Select A1 (time & price) and B1 (time & price).
-The script calculates the base slope depending on the selected base angle:
Linear scale: slope = (B1 − A1) / Δt / base_angle_value
Logarithmic scale: slope = (ln(B1) − ln(A1)) / Δt / base_angle_value
-Each enabled angle is drawn from A1, extended by the chosen number of bars, and labeled with its value.
-Fan color is determined automatically by direction (green for upward, red for downward) or can be overridden.
Quick Start
-Add the indicator to your chart.
-In settings:
A1 Time/Price — starting point.
B1 Time/Price — second point (defines slope).
Base Angle — choose 8/1, 1/1, or 1/8.
Extend Fan (Bars) — number of bars to extend lines into the future.
Logarithmic Fan Calculation — toggle for log-scale mode.
Enable desired angle sets: Main, Fibonacci, or Custom.
-Optionally, enable Use Custom Fan Color and set your own color.
Settings
Enable Fan — master switch.
A1 Time/A1 Price, B1 Time/B1 Price — anchor points.
Base Angle — 8/1, 1/1, 1/8.
Extend Fan (Bars) — extension length.
Use Custom Fan Color / Fan Color — manual color override.
Main Angles — 1/8, 1/4, 1/3, 1/2, 1/1, 2/1, 3/1, 4/1, 6/1, 8/1.
Fibonacci Angles — 0.214, 0.35, 0.382, 0.618, 0.786, 0.886, 0.9335, 1.118, 1.236, 1.382, 1.618.
Custom Angles — up to 10 values (dotted lines), labels from the exact value.
Usage Tips
-Choosing A1 and B1:
A1 — significant starting swing high or low.
B1 — next key swing to define slope.
-Logarithmic scale:
Ideal for long-term exponential trends (crypto, growth stocks).
Prices must be > 0.
-Watch how price reacts to different angles:
1/1 as median trend, fractional for support/resistance, multiples for acceleration/slowdown.
Disclaimer
This is a technical analysis tool. It is not financial advice. Trading decisions are made at your own risk.
Gann Fan Master – Selectable Base Angle & Fibonacci Angles
Индикатор строит веер Ганна от точки A1 через точку B1 с полной кастомизацией:
Выбор базового угла (8/1, 1/1, 1/8)
Набор основных углов
Углы Фибоначчи
До 10 пользовательских углов
Расчёт в логарифмической или линейной шкале
Цвет веера по направлению или заданный вручную
Настройка длины продления линий
Идеально подходит для ручного анализа графика — вы задаёте A1 и B1, а скрипт рассчитывает и строит веер с подписями углов.
Как это работает
-Задайте A1 (время и цена) и B1 (время и цена).
-Скрипт рассчитывает базовый наклон в зависимости от выбранного базового угла:
Линейная шкала: наклон = (B1 − A1) / Δt / base_angle_value
Логарифмическая шкала: наклон = (ln(B1) − ln(A1)) / Δt / base_angle_value
-Каждый включённый угол рисуется из точки A1, продлевается на заданное число баров и подписывается.
-Цвет линий определяется автоматически по направлению (зелёный — вверх, красный — вниз) или задаётся вручную.
Быстрый старт
1)Добавьте индикатор на график.
2)В настройках:
A1 Time/Price — начальная точка.
B1 Time/Price — вторая точка (задаёт наклон).
Base Angle — выберите 8/1, 1/1 или 1/8.
Extend Fan (Bars) — длина продления линий в барах.
Logarithmic Fan Calculation — переключатель логарифмического режима.
Включите нужные блоки углов: Main, Fibonacci, Custom.
3)При желании активируйте Use Custom Fan Color и задайте цвет веера.
Настройки
Enable Fan — общий выключатель.
A1 Time/A1 Price, B1 Time/B1 Price — опорные точки.
Base Angle — 8/1, 1/1, 1/8.
Extend Fan (Bars) — продление линий.
Use Custom Fan Color / Fan Color — цвет вручную.
Main Angles — 1/8, 1/4, 1/3, 1/2, 1/1, 2/1, 3/1, 4/1, 6/1, 8/1.
Fibonacci Angles — 0.214, 0.35, 0.382, 0.618, 0.786, 0.886, 0.9335, 1.118, 1.236, 1.382, 1.618.
Custom Angles — до 10 значений (точечные линии) с подписями.
Советы по применению
Выбор A1 и B1:
A1 — значимый экстремум начала движения.
B1 — следующий важный экстремум для задания наклона.
Логарифмическая шкала:
Подходит для долгосрочных экспоненциальных трендов (крипто, акции роста).
Цена должна быть > 0.
Следите, как цена реагирует на разные углы:
1/1 — медианный тренд.
Дробные углы — потенциальная поддержка/сопротивление.
Кратные — ускорение/замедление движения.
Дисклеймер
Это инструмент технического анализа и не является инвестиционной рекомендацией. Торговые решения вы принимаете на свой страх и риск.
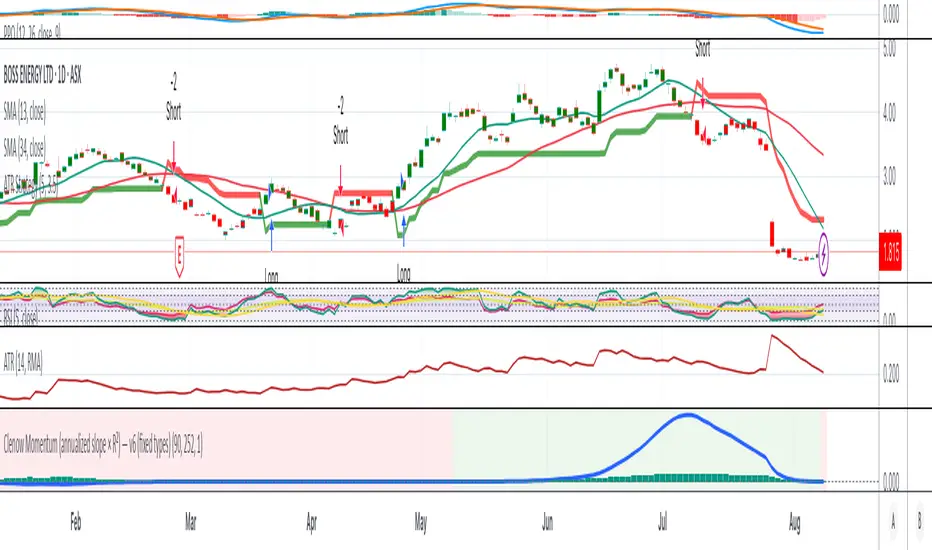
Clenow Momentum (annualized slope × R²) — v6 (fixed types)Clenow Momentum Indicator calculates the annualised exponential regression slope over a 90 day look back period and multiplies it by the R-squared of that regression
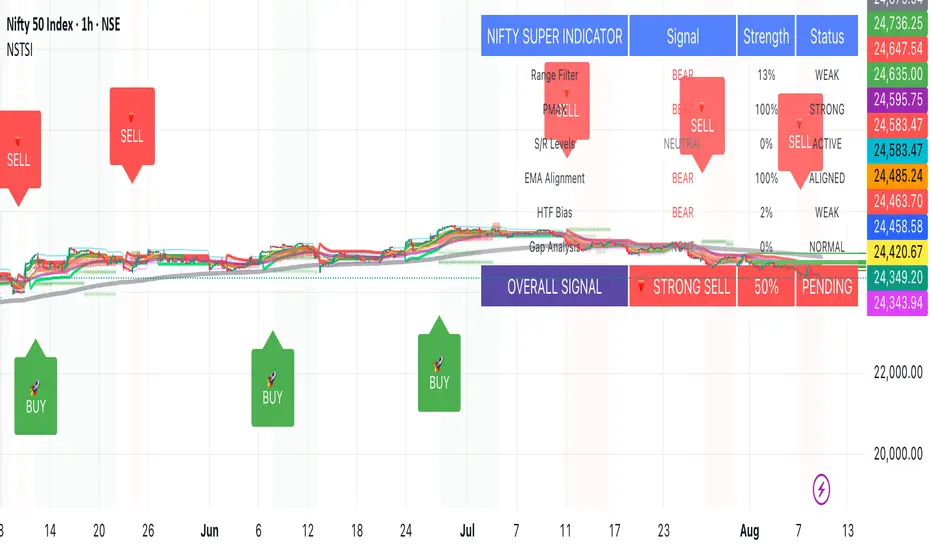
Nifty50 Swing Trading Super Indicator# 🚀 Nifty50 Swing Trading Super Indicator - Complete Guide
**Created by:** Gaurav
**Date:** August 8, 2025
**Version:** 1.0 - Optimized for Indian Markets
---
## 📋 Table of Contents
1. (#quick-start-guide)
2. (#indicator-overview)
3. (#installation-instructions)
4. (#parameter-settings)
5. (#signal-interpretation)
6. (#trading-strategy)
7. (#risk-management)
8. (#optimization-tips)
9. (#troubleshooting)
---
## 🎯 Quick Start Guide
### What You Get
✅ **2 Complete Pine Script Indicators:**
- `swing_trading_super_indicator.pine` - Universal version for all markets
- `nifty_optimized_super_indicator.pine` - Specifically optimized for Nifty50 & Indian stocks
✅ **Key Features:**
- Multi-component signal confirmation system
- Optimized for daily and 3-hour timeframes
- Built-in risk management with dynamic stops and targets
- Real-time signal strength monitoring
- Gap analysis for Indian market characteristics
### Immediate Setup
1. Copy the Pine Script code from `nifty_optimized_super_indicator.pine`
2. Paste into TradingView Pine Editor
3. Add to chart on daily or 3-hour timeframe
4. Look for 🚀BUY and 🔻SELL signals
5. Use the information table for signal confirmation
---
## 🔍 Indicator Overview
### Core Components Integration
**🎯 Range Filter (35% Weight)**
- Primary trend identification using adaptive volatility filtering
- Optimized sampling period: 21 bars for Indian market volatility
- Enhanced range multiplier: 3.0 to handle market gaps
- Provides trend direction and strength measurement
**⚡ PMAX (30% Weight)**
- Volatility-adjusted trend confirmation using ATR-based calculations
- Dynamic multiplier adjustment based on market volatility
- 14-period ATR with 2.5 multiplier for swing trading sensitivity
- Offers trailing stop functionality
**🏗️ Support/Resistance (20% Weight)**
- Dynamic level identification using pivot point analysis
- Tighter channel width (3%) for precise Indian market levels
- Enhanced strength calculation with historical interaction weighting
- Provides entry/exit timing and breakout signals
**📊 EMA Alignment (15% Weight)**
- Multi-timeframe moving average confirmation
- Key EMAs: 9, 21, 50, 200 (popular in Indian markets)
- Hierarchical alignment scoring for trend strength
- Additional trend validation layer
### Advanced Features
**🌅 Gap Analysis**
- Automatic detection of significant price gaps (>2%)
- Gap strength measurement and impact on signals
- Specific optimization for Indian market overnight gaps
- Visual gap markers on chart
**⏰ Multi-Timeframe Integration**
- Higher timeframe bias from daily/weekly data
- Configurable daily bias weight (default 70%)
- 3-hour confirmation for precise entry timing
- Prevents counter-trend trades against major timeframe
**🛡️ Risk Management**
- Dynamic stop-loss calculation using multiple methods
- Automatic profit target identification
- Position sizing guidance based on signal strength
- Anti-whipsaw logic to prevent false signals
---
## 📥 Installation Instructions
### Step 1: Access TradingView
1. Open TradingView.com
2. Navigate to Pine Editor (bottom panel)
3. Create a new indicator
### Step 2: Copy the Code
**For Nifty50 & Indian Stocks (Recommended):**
```pinescript
// Copy entire content from nifty_optimized_super_indicator.pine
```
**For Universal Use:**
```pinescript
// Copy entire content from swing_trading_super_indicator.pine
```
### Step 3: Configure and Apply
1. Click "Add to Chart"
2. Select daily or 3-hour timeframe
3. Adjust parameters if needed (defaults are optimized)
4. Enable alerts for signal notifications
### Step 4: Verify Installation
- Check that all components are visible
- Confirm information table appears in top-right
- Test with known trending stocks for signal validation
---
## ⚙️ Parameter Settings
### 🎯 Range Filter Settings
```
Sampling Period: 21 (optimized for Indian market volatility)
Range Multiplier: 3.0 (handles overnight gaps effectively)
Source: Close (most reliable for swing trading)
```
### ⚡ PMAX Settings
```
ATR Length: 14 (standard for daily/3H timeframes)
ATR Multiplier: 2.5 (balanced for swing trading sensitivity)
Moving Average Type: EMA (responsive to price changes)
MA Length: 14 (matches ATR period for consistency)
```
### 🏗️ Support/Resistance Settings
```
Pivot Period: 8 (shorter for Indian market dynamics)
Channel Width: 3% (tighter for precise levels)
Minimum Strength: 3 (higher quality levels only)
Maximum Levels: 4 (focus on strongest levels)
Lookback Period: 150 (sufficient historical data)
```
### 🚀 Super Indicator Settings
```
Signal Sensitivity: 0.65 (balanced for swing trading)
Trend Strength Requirement: 0.75 (high quality signals)
Gap Threshold: 2.0% (significant gap detection)
Daily Bias Weight: 0.7 (strong higher timeframe influence)
```
### 🎨 Display Options
```
Show Range Filter: ✅ (trend visualization)
Show PMAX: ✅ (trailing stops)
Show S/R Levels: ✅ (key price levels)
Show Key EMAs: ✅ (trend confirmation)
Show Signals: ✅ (buy/sell alerts)
Show Trend Background: ✅ (visual trend state)
Show Gap Markers: ✅ (gap identification)
```
---
## 📊 Signal Interpretation
### 🚀 BUY Signals
**Requirements for BUY Signal:**
- Price above Range Filter with upward trend
- PMAX showing bullish direction (MA > PMAX line)
- Support/resistance breakout or favorable positioning
- EMA alignment supporting upward movement
- Higher timeframe bias confirmation
- Overall signal strength > 75%
**Signal Strength Indicators:**
- **90-100%:** Extremely strong - Maximum position size
- **80-89%:** Very strong - Large position size
- **75-79%:** Strong - Standard position size
- **65-74%:** Moderate - Reduced position size
- **<65%:** Weak - Wait for better opportunity
### 🔻 SELL Signals
**Requirements for SELL Signal:**
- Price below Range Filter with downward trend
- PMAX showing bearish direction (MA < PMAX line)
- Resistance breakdown or unfavorable positioning
- EMA alignment supporting downward movement
- Higher timeframe bias confirmation
- Overall signal strength > 75%
### ⚖️ NEUTRAL Signals
**Characteristics:**
- Conflicting signals between components
- Low overall signal strength (<65%)
- Range-bound market conditions
- Wait for clearer directional bias
### 📈 Information Table Guide
**Component Status:**
- **BULL/BEAR:** Current signal direction
- **Strength %:** Component contribution strength
- **Status:** Additional context (STRONG/WEAK/ACTIVE/etc.)
**Overall Signal:**
- **🚀 STRONG BUY:** All systems aligned bullish
- **🔻 STRONG SELL:** All systems aligned bearish
- **⚖️ NEUTRAL:** Mixed or weak signals
---
## 💼 Trading Strategy
### Daily Timeframe Strategy
**Setup:**
1. Apply indicator to daily chart of Nifty50 or Indian stocks
2. Wait for 🚀BUY or 🔻SELL signal with >75% strength
3. Confirm higher timeframe bias alignment
4. Check for significant support/resistance levels
**Entry:**
- Enter on signal bar close or next bar open
- Use 3-hour chart for precise entry timing
- Avoid entries during major news events
- Consider gap analysis for overnight positions
**Position Sizing:**
- **>90% Strength:** 3-4% of portfolio
- **80-89% Strength:** 2-3% of portfolio
- **75-79% Strength:** 1-2% of portfolio
- **<75% Strength:** Avoid or minimal size
### 3-Hour Timeframe Strategy
**Setup:**
1. Confirm daily timeframe bias first
2. Apply indicator to 3-hour chart
3. Look for signals aligned with daily trend
4. Use for entry/exit timing optimization
**Entry Refinement:**
- Wait for 3H signal confirmation
- Enter on pullbacks to key levels
- Use tighter stops for better risk/reward
- Monitor intraday support/resistance
### Risk Management Rules
**Stop Loss Placement:**
1. **Primary:** Use indicator's dynamic stop level
2. **Secondary:** Below/above nearest support/resistance
3. **Maximum:** 2-3% of portfolio per trade
4. **Trailing:** Move stops with PMAX line
**Profit Taking:**
1. **Target 1:** First resistance/support level (50% position)
2. **Target 2:** Second resistance/support level (30% position)
3. **Runner:** Trail remaining 20% with PMAX
**Position Management:**
- Review positions at daily close
- Adjust stops based on new signals
- Exit if trend changes to opposite direction
- Reduce size during high volatility periods
---
## 🎯 Optimization Tips
### For Nifty50 Trading
- Use daily timeframe for primary signals
- Monitor sector rotation impact
- Consider index futures for better liquidity
- Watch for RBI policy and global cues impact
### For Individual Stocks
- Verify stock follows Nifty correlation
- Check sector-specific news and events
- Ensure adequate liquidity for position size
- Monitor earnings calendar for volatility
### Market Condition Adaptations
**Trending Markets:**
- Increase position sizes for strong signals
- Use wider stops to avoid whipsaws
- Focus on trend continuation signals
- Reduce counter-trend trading
**Range-Bound Markets:**
- Reduce position sizes
- Use tighter stops and quicker profits
- Focus on support/resistance bounces
- Increase signal strength requirements
**High Volatility Periods:**
- Reduce overall exposure
- Use smaller position sizes
- Increase stop-loss distances
- Wait for clearer signals
### Performance Monitoring
- Track win rate and average profit/loss
- Monitor signal quality over time
- Adjust parameters based on market changes
- Keep trading journal for pattern recognition
---
## 🔧 Troubleshooting
### Common Issues
**Q: Signals appear too frequently**
A: Increase "Trend Strength Requirement" to 0.8-0.9
**Q: Missing obvious trends**
A: Decrease "Signal Sensitivity" to 0.5-0.6
**Q: Too many false signals**
A: Enable "3H Confirmation" and increase strength requirements
**Q: Indicator not loading**
A: Check Pine Script version compatibility (requires v5)
### Parameter Adjustments
**For More Sensitive Signals:**
- Decrease Signal Sensitivity to 0.5-0.6
- Decrease Trend Strength Requirement to 0.6-0.7
- Increase Range Filter multiplier to 3.5-4.0
**For More Conservative Signals:**
- Increase Signal Sensitivity to 0.7-0.8
- Increase Trend Strength Requirement to 0.8-0.9
- Enable all confirmation features
### Performance Issues
- Reduce lookback periods if chart loads slowly
- Disable some visual elements for better performance
- Use on liquid stocks/indices for best results
---
## 📞 Support & Updates
This super indicator combines the best of Range Filter, PMAX, and Support/Resistance analysis specifically optimized for Indian market swing trading. The multi-component approach significantly improves signal quality while the built-in risk management features help protect capital.
**Remember:** No indicator is 100% accurate. Always combine with proper risk management, market analysis, and your trading experience for best results.
**Happy Trading! 🚀**
CoinSidual SR Top3What it does
Plots up to 3 Resistance (red) and 3 Support (green) zones using confirmed swing highs/lows. Nearby levels are clustered by tolerance (bps) to avoid duplicates. Lines extend left/right and auto-update.
Inputs
• Swing Length – pivot lookback/forward
• Lookback Bars – analysis window size
• Cluster Tolerance (bps) – merge distance
• Line Extend Bars – label/line span
• Show R/S Labels – toggle labels
Notes
Works on any symbol/timeframe. No alerts. For educational use only.
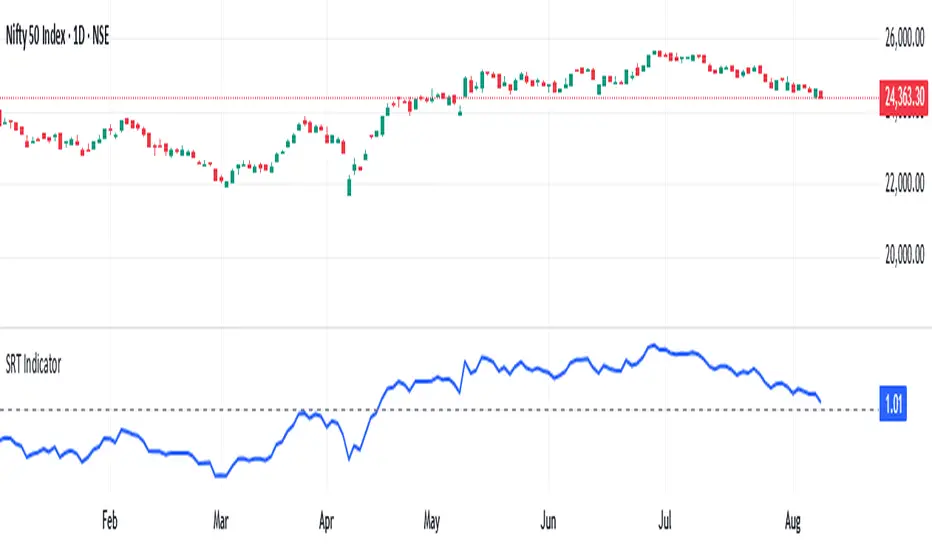
SRT Indicatorthis indicator simply plots the value of SRT below the chart. it is current spot price of nifty divided by its 124 daily SMA. typically one invests when srt is 0.7 to 0.9 and exits when it crosses 1.25. this can be adjusted according to our risk appetite.
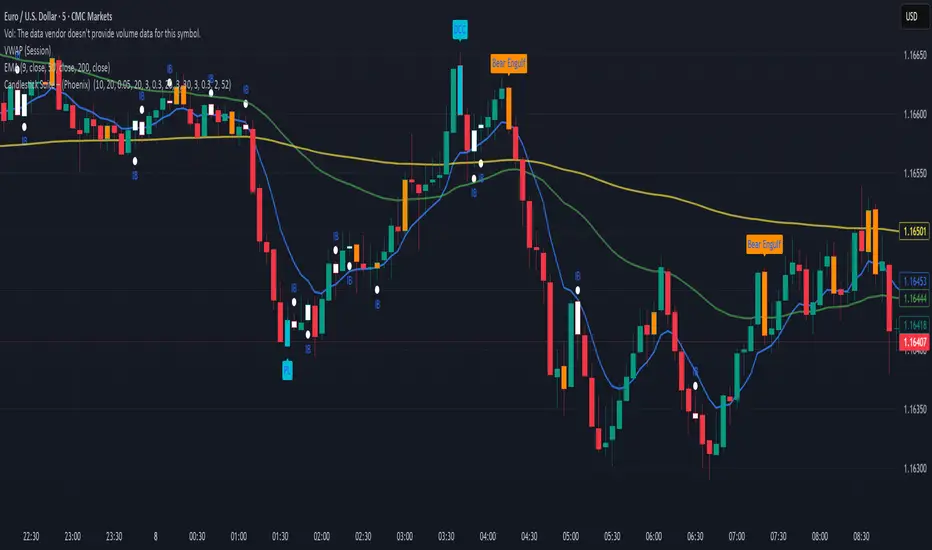
Candlestick Suite–(Phoenix) it colors the major Reversal candlesticks
BullEngulf or BearEngulf or Engulfing() -> DARK_ORANGE
PiercingLine or DarkCloudCover -> CYAN
BullishHarami or BearishHarami -> YELLOW
BullishInsideBar or BearishInsideBar -> WHITE