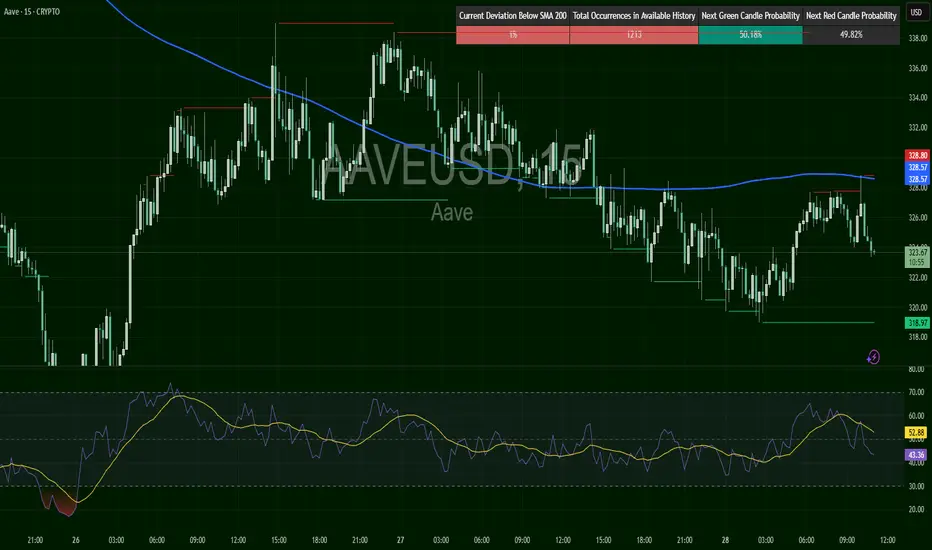
AAVE/USD – Stuck Below SMA200🔴 SHORT below $328.68 – target $318.97
AAVE trades at $326.6, just under its 200 SMA ($328.68). Resistance is capped at $328.80, while support lies at $318.97. RSI at 56 shows balanced momentum. A rejection below $328.68 risks pullback toward $319.
AAVEUSD trade ideas
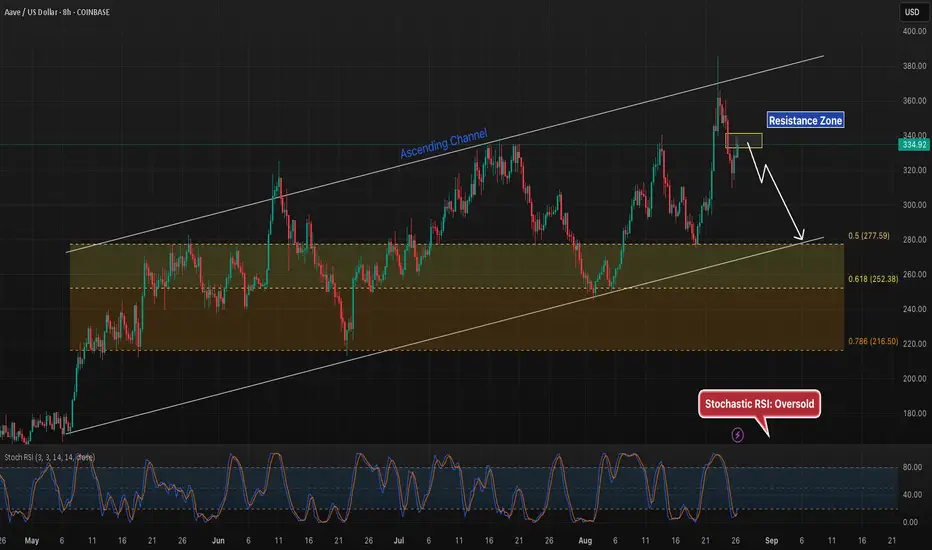
AAVE 8H – Resistance Hit, Watching Channel Support NextAAVE is trading inside an ascending channel, rejecting from resistance near 334.
Bearish path: Rejection at the yellow resistance zone sets up a pullback toward the Fib Golden Pocket, aligned with channel support around 277–252.
Bullish path: A sustained reclaim above resistance would shift momentum, putting higher channel levels back in play.
With Stoch RSI oversold, momentum could support a short-term bounce, but the reaction here decides if AAVE holds trend or tests deeper support.
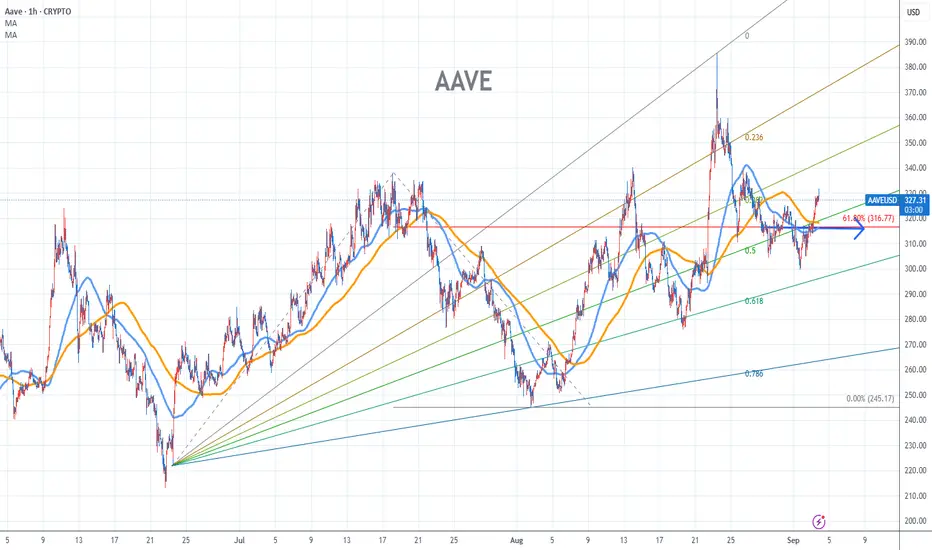
AAVE Stock Chart Fibonacci Analysis 090325Trading Idea
1) Find a FIBO slingshot
2) Check FIBO 61.80% level
3) Entry Point > 316/61.80%
Chart time frame:B
A) 15 min(1W-3M)
B) 1 hr(3M-6M)
C) 4 hr(6M-1year)
D) 1 day(1-3years)
Stock progress:A
A) Keep rising over 61.80% resistance
B) 61.80% resistance
C) 61.80% support
D) Hit the bottom
E) Hit the top
Stocks rise as they rise from support and fall from resistance. Our goal is to find a low support point and enter. It can be referred to as buying at the pullback point. The pullback point can be found with a Fibonacci extension of 61.80%. This is a step to find an entry-level position. 1) Find a triangle (Fibonacci Speed Fan Line) that connects the high (resistance) and low (support) points of the stock in progress, where it is continuously expressed as a Slingshot, 2) and create a Fibonacci extension level for the first rising wave from the start point of the slingshot pattern.
When the current price goes over the 61.80% level, that can be a good entry point, especially if the SMA 100 and 200 curves are gathered together at 61.80%, it is a very good entry point.
As a great help, TradingView provides these Fibonacci speed fan lines and extension levels with ease. So if you use the Fibonacci fan line, the extension level, and the SMA 100/200 curve well, you can find an entry point for the stock market. At least you have to enter at this low point to avoid trading failure, and if you are skilled at entering this low point, with the fibonacci6180 technique, your reading skill of to chart will be greatly improved.
If you want to do day trading, please set the time frame to 5 minutes or 15 minutes, and you will see many of the low points of rising stocks.
If you prefer long-term range trading, you can set the time frame to 1 hr or 1 day
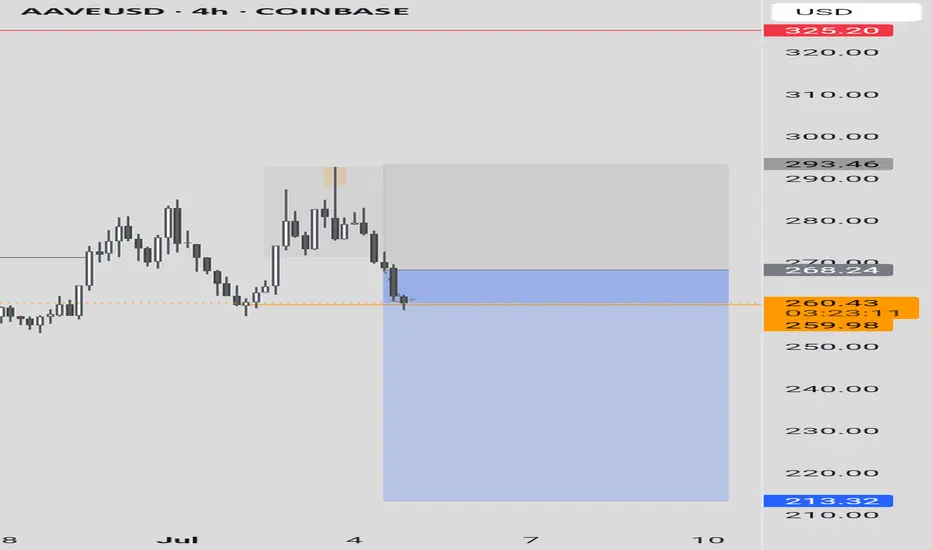
AAVE Ending Diagonal?We have some more clarity with the local AAVE pattern and it does appear to be an Elliot wave ending diagonal. After a strong wave 3 ending diagonals form as a terminal pattern with a thrust above the trend line threshold and drop back down to complete a higher degree motif wave 1.
The following retracement has a high probability of terminating at the wave 4 bottom which in this case is at the High Volume Node support and 0.5 Fibonacci retracement at $210.
RSI has printed a series of bearish divergence from overbought but this took a long time to play out!
Analysis is invalidated if price breaks above $400.
Safe trading
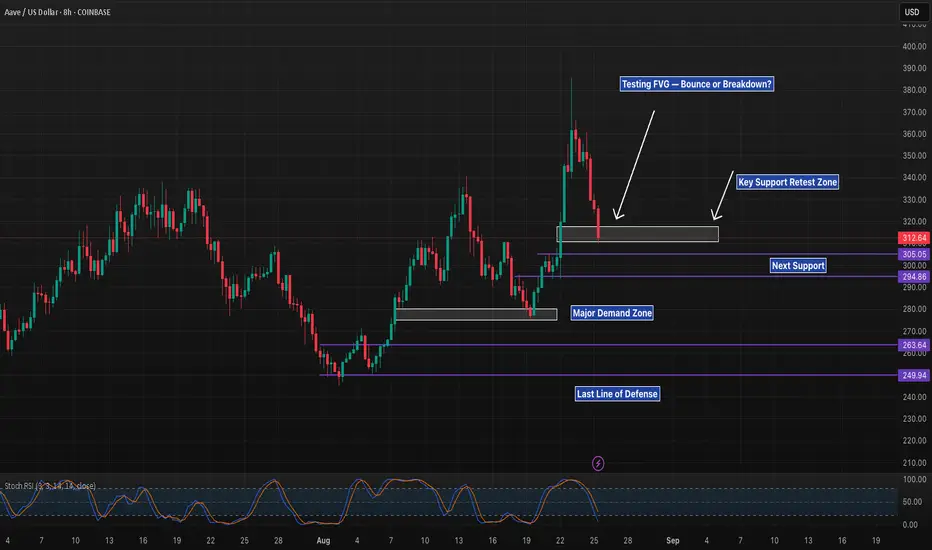
AAVE 8H – Retesting Support, Will Bulls Defend $305?AAVE has pulled back sharply from the recent spike near $327 and is now retesting the highlighted support zone around $312–305. This area is critical since it served as a strong breakout base earlier.
Below current price, the next support levels line up at $295, $264, and $250 — each representing deeper demand zones. A decisive breakdown of $305 could shift momentum back toward the broader downtrend, while a successful defense here may fuel another leg higher.
The Stoch RSI is entering oversold territory, hinting at possible relief. However, price structure will ultimately dictate direction — a clean reclaim and higher low formation could favor bulls, while sustained weakness risks continuation to the downside.
Traders should watch the $305 zone closely for confirmation.
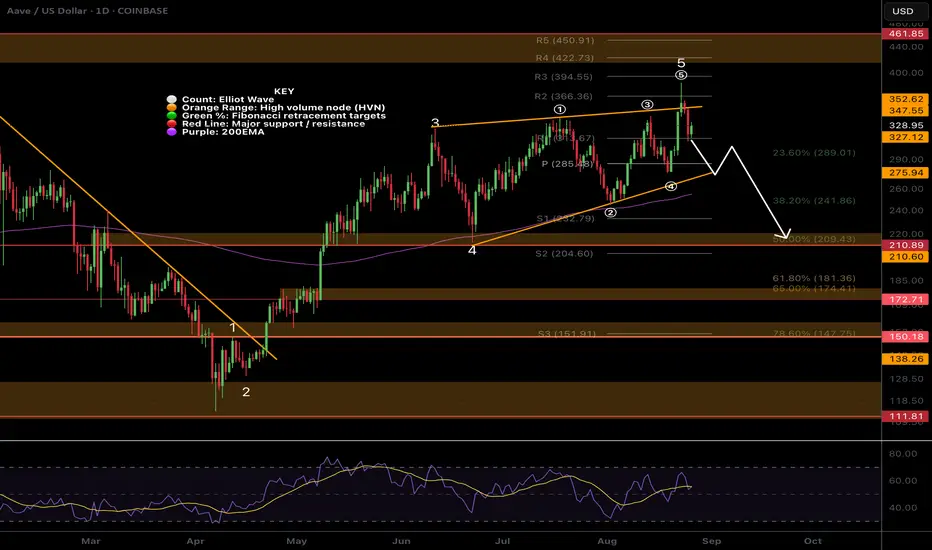
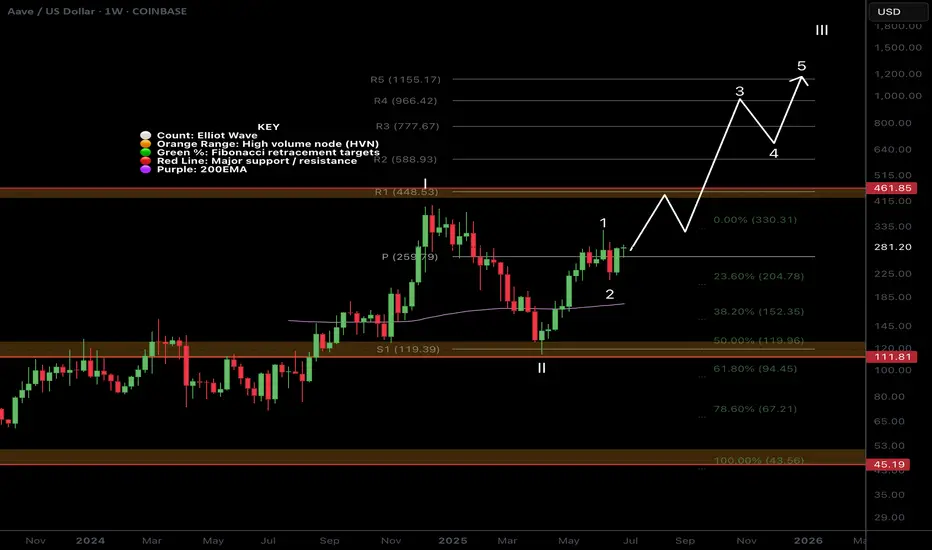
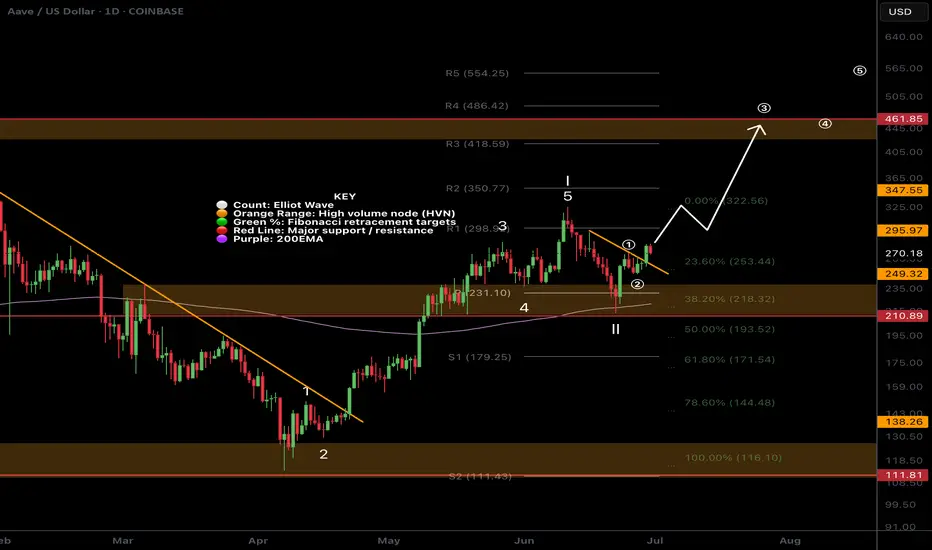
$AAVE Set for all time high?AAVE tested the weekly pivot as support and after a secondary pullback to the 0.236 Fibonacci retracement, sky rocketed alongside BTC and crypto yesterday to a new local high.
Wave III looks truly underway with this kind of price action and the target remains the R5 weekly pivot at $1155. High Volume Node resistance at $460 and $670 are the next targets.
Weekly RSI has plenty of room to grow to get to overbought.
Analysis is invalidated below $111 so plenty of room to breathe!
Safe trading

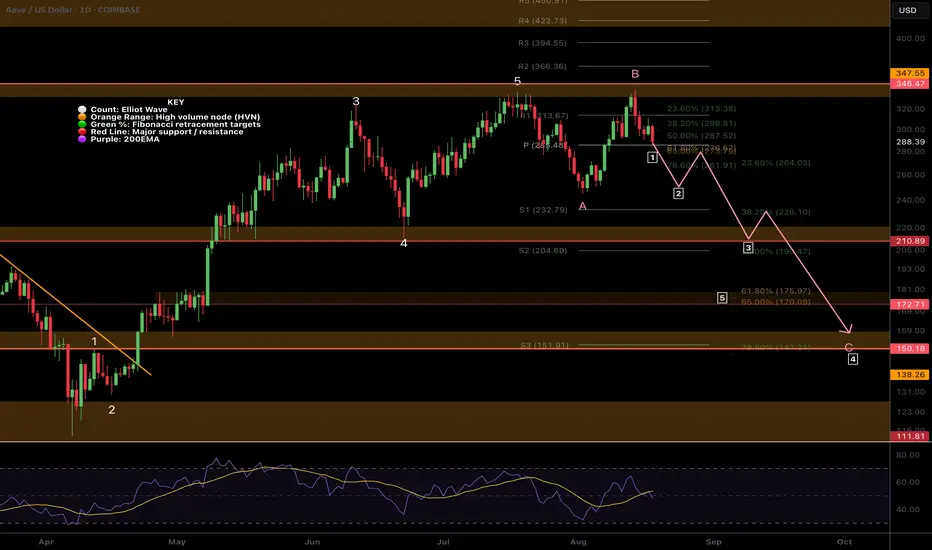
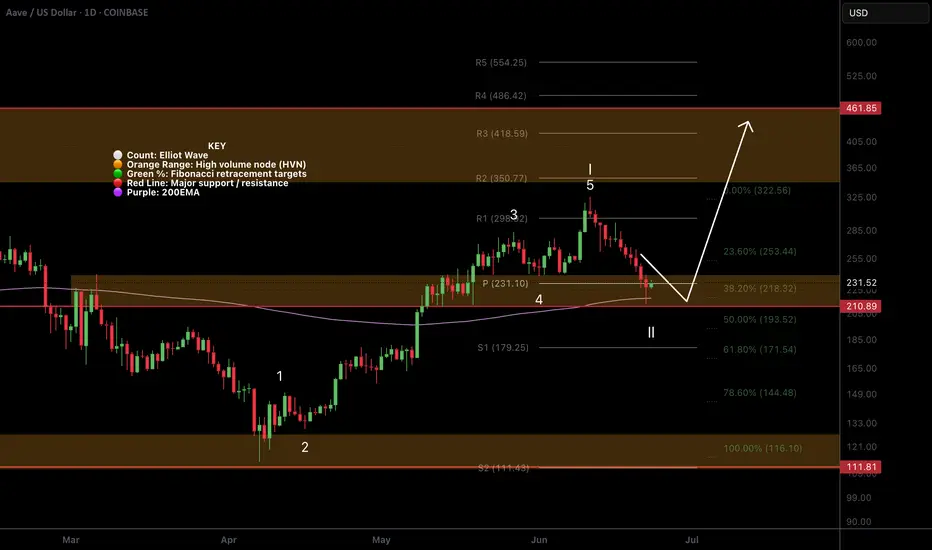
$AAVE Local Expanded Flat Correction?CRYPTOCAP:AAVE Elliot wave count could be printing an expanded flat correction in wave 2.
5 waves up complete a motif wave with daily RSI in overbought. 3 clear waves down for wave A (or X) was next followed by a poke above all time on confirmed bearish divergence.
If the count is correct then our first target would be a swing below wave A and the ascending daily 200EMA at point . Further decline in wave C (or Z) brings up the previous wave 4 target and the High Volume Node major support $210 point
A steeper decline in wave 2, aligning with my September dump idea, brings up the golden pocket at but a more likely target is the alt-coin golden packet at 0.786, s3 daily pivot and High Volume Node support . This would be a great buy opportunity for me.
Safe trading
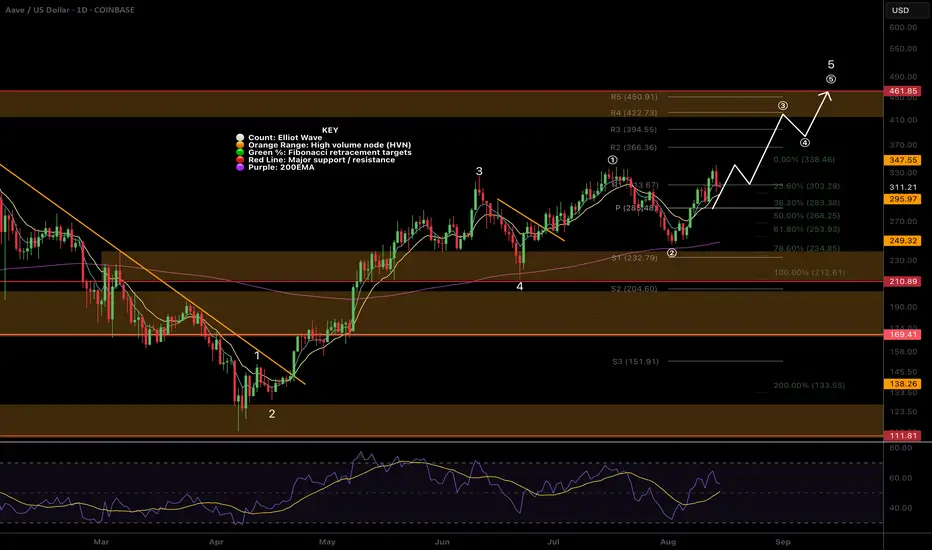
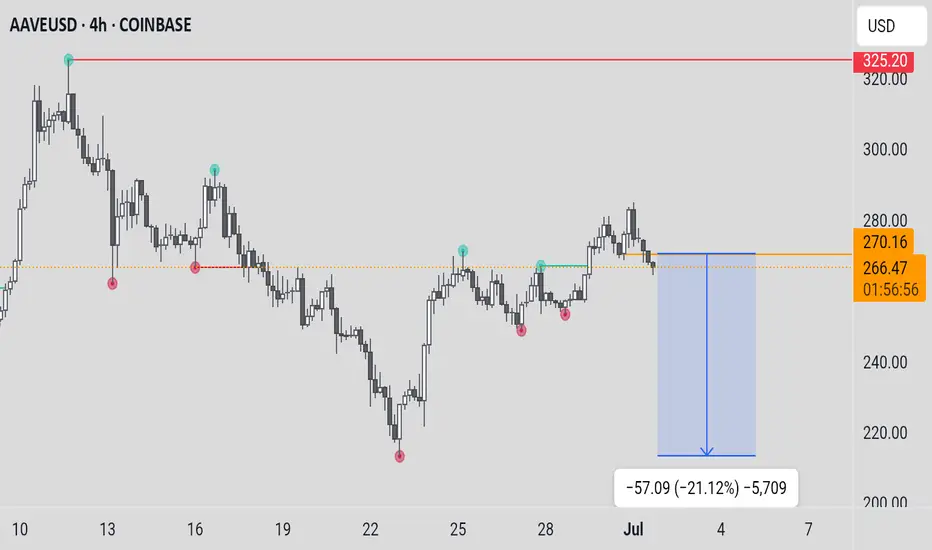
$AAVE Continues to follow the path!CRYPTOCAP:AAVE was immediately reject from the swing high as expected, per the percentage band take profit rules.
Daily RSI has plenty of room to grow to reach the all time High Volume Node resistance which is the next target at $430.
Based on the depth of wave (2) after touching the daily 200EMA as support, wave 3 is still underway to complete the larger degree wave 5 with a poke above all high, the highest probability terminal target per Elliot wave rules.
Safe trading
For those interested in trading signals / diary & trade management / trading parameters etc... Signals updated for 15/08/25
✅ LSE:ONDO DEMA Percentage Band rule added
✅ CRYPTOCAP:BTC hit take profit #2 for 2.59RR
✅ CRYPTOCAP:AAVE (DEMA) HIt take profit 1 for 1.45RR
✅ CRYPTOCAP:ADA moved 10% after signal activation but still not hit take profit 1
✅ NASDAQ:AAPL (Apple) very close to take profit #1
✅ BTC added to completed trade signals along side Take profit 2 for google, 700, HBAR and a few stop (INJ, SOL, BTDR) and invalidations for META, SHIBINU, WLD)
Safe trading
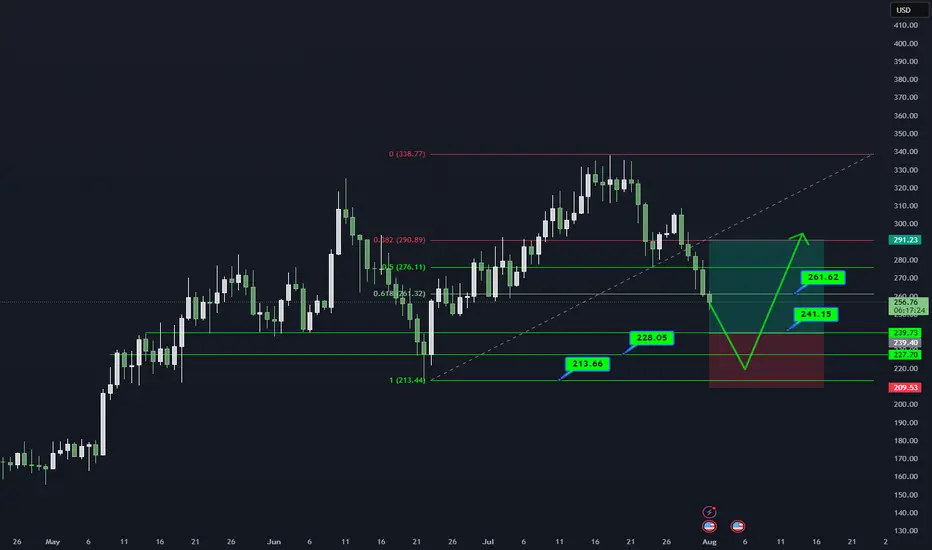
AAVE/USDT DAILY OUTLOOK📊 AAVE/USDT – DAILY TECHNICAL OUTLOOK
🔍 MARKET STRUCTURE
AAVE critical demand zone (241–228) par trade kar raha hai.
Higher timeframe trend bullish jab tak 213 strong base hold karta hai.
📌 KEY LEVELS TO WATCH
Support Zones: 241.15 → 228.05 → 213.66 (Major Base)
Resistance Zones: 261.62 → 291.23
Breakout Confirmation: Daily close above 261 could open path to 291.
🎯 TRADING PLAN (25% SCALING STRATEGY)
Entries ko 25% ke 4 parts me divide karein:
241.15
228.05
220–213 support range
Targets: 261.62 → 291.23
Stop Loss: Daily close below 213
⚠️ RISK MANAGEMENT NOTE
Spot trades safer. Leverage trading = technical gambling.
Capital preservation = long-term survival.
📖 QUOTE
"The big money is made by sitting, not trading." – Reminiscences of a Stock Operator
💬 WHAT’S YOUR VIEW ON AAVE?
Bullish bounce from demand zone or deeper retest ahead?
Share your thoughts in the comments!
#AAVE #CryptoTrading #Altcoins #TradingView #TechnicalAnalysis #CryptoCommunity #RiskManagement #SpotTrading
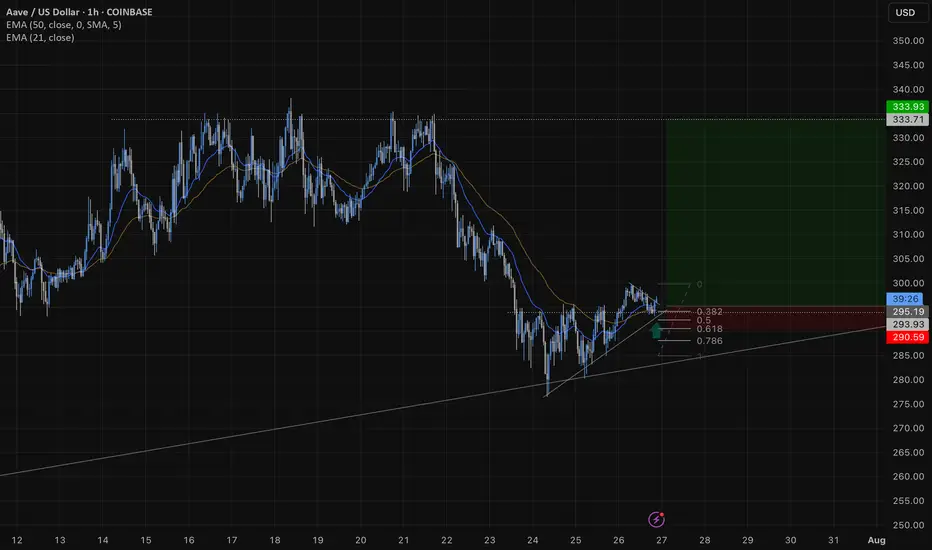
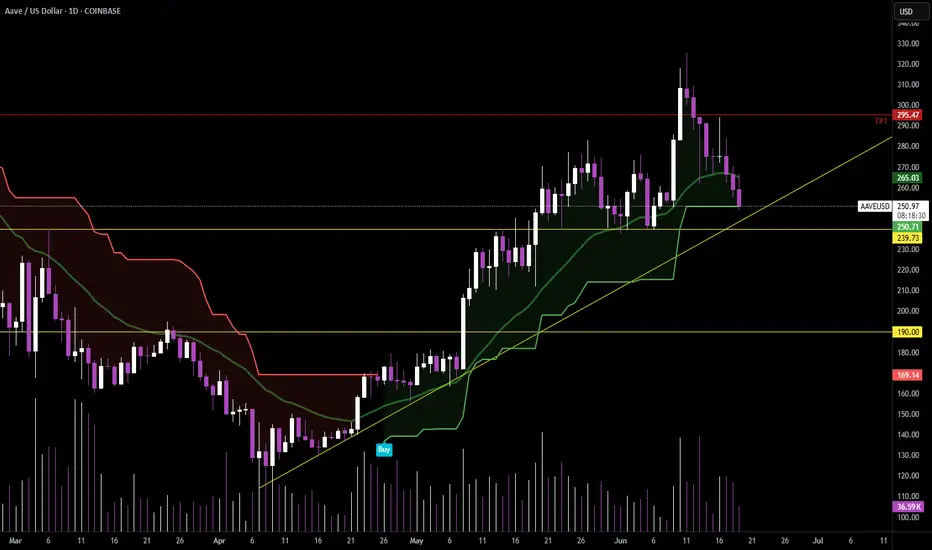
AAVE Long The daily is currently making HH / HL testing the daily 50 ema and ascending trend line
The 1h was a perfect entry, ascending triangle break out and re/test of the 1h 50 ema, fib levels and making a higher low
$AAVE Daily Hidden Bullish divergence?CRYPTOCAP:AAVE and alts begin their retracement Wednesday but is this a long term top or just local? Im betting we have a higher to go this summer..
Hidden daily bullish divergence is printing on RSI at the daily pivot and 0.5 Fibonacci retracement which should all act as strong support provided BTC doesn't dump.
The 'alt-coin golden pocket' Fibonacci retracement 0.786 sits at the descending daily 200EMA and High Volume Node support offering a secondary target for reversal and continued upside.
Losing this and closing below would flip me bearish until a new bullish signal emerges.
Safe trading.
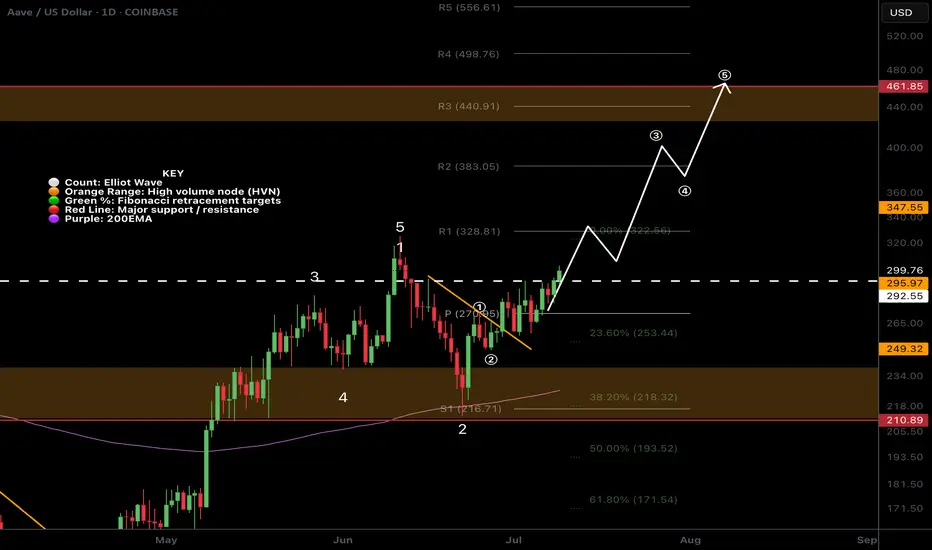
$AAVE Macro outlook Grinding the PathCRYPTOCAP:AAVE continues to grind higher poking above the swing high which was rejected to test the weekly pivot and .382 Fibonacci retracement as support successfully. This was a shallow wave 2 so I am expecting a big thrust up in wave 3. However, the alternative count could suggest a wave is only completing now with wave 2 actually being wave (4) of 1, this would be the case if price falls back below $171.
Weekly RSI is still bullish with plenty of room to rise ahead of it. It printed a weekly bullish divergence at the wave II low and major support high volume node.
AAVE is definitely one too watch this cycle.
Safe trading

$AAVE Ready to Pop?EURONEXT:AAVE long signal is now active.
Price is still well above the daily pivot and daily 200EMA showing a strong local trend.
I am still expecting a decent move to test the all time high, High Volume Node at $460.
Safe trading
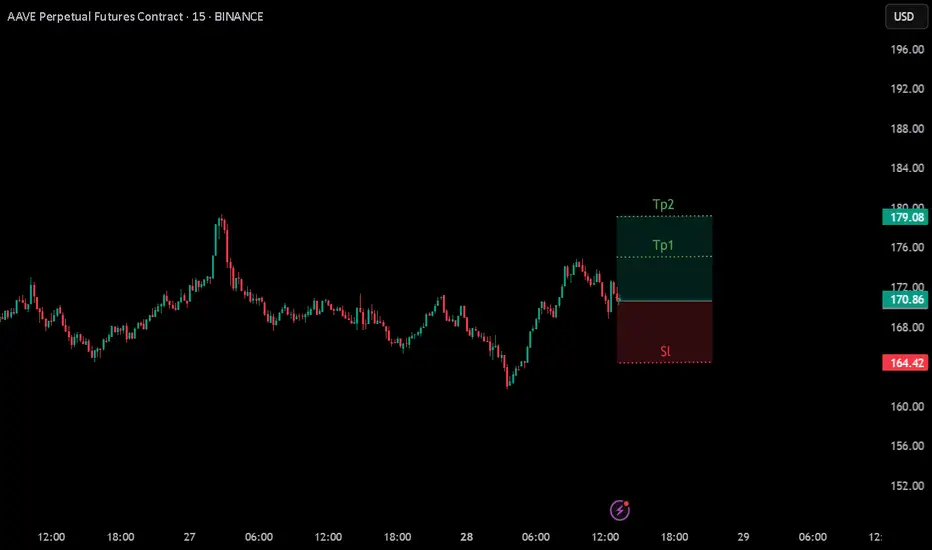
AAVEUSDT Cryptocurrency Futures Market Disclaimer 🚨🚨🚨
Trading cryptocurrency futures involves high risks and is not suitable for all investors.
Cryptocurrency prices are highly volatile, which can lead to significant gains or losses in a short period.
Before engaging in crypto futures trading, consider your risk tolerance, experience, and financial situation.
Risk of Loss: You may lose more than your initial capital due to the leveraged nature of futures. You are fully responsible for any losses incurred.
Market Volatility: Crypto prices can fluctuate significantly due to factors such as market sentiment, regulations, or unforeseen events.
Leverage Risk: The use of leverage can amplify profits but also increases the risk of total loss.
Regulatory Uncertainty: Regulations related to cryptocurrencies vary by jurisdiction and may change, affecting the value or legality of trading.
Technical Risks: Platform disruptions, hacking, or technical issues may result in losses.
This information is not financial, investment, or trading advice. Consult a professional financial advisor before making decisions. We are not liable for any losses or damages arising from cryptocurrency futures trading.
Note: Ensure compliance with local regulations regarding cryptocurrency trading in your region.
thanks for like and follow @ydnldn to have more information outlook and free signal.
About me :
"I am a passionate swing trader focused on analyzing financial markets to capture profit opportunities from medium-term price movements. With a disciplined approach and in-depth technical analysis, I concentrate on identifying trends, support-resistance levels, and price patterns to make informed trading decisions. I prioritize strict risk management to protect capital while maximizing profit potential. Always learning and adapting to market dynamics, I enjoy the process of refining strategies to achieve consistency in trading."
$AAVE Going Through a Major Bullish Trend Shift!CRYPTOCAP:AAVE continues to outperform on pumps and retracements this cycle after being beaten down for many years!
Price consolidated below the weekly pivot and found support, only retracing to the .618 Fibs.
Wave 3 of iii pf a new Elliot Motif Wave looks well underway with the next price target being the R1 weekly pivot High Volume Node at $448.
Long term outlooks is very bullish for AAVE with a terminal target of the R5 weekly pivot £1155
Safe trading
AAVEUSDTCryptocurrency Futures Market Disclaimer 🚨🚨🚨
Trading cryptocurrency futures involves high risks and is not suitable for all investors.
Cryptocurrency prices are highly volatile, which can lead to significant gains or losses in a short period.
Before engaging in crypto futures trading, consider your risk tolerance, experience, and financial situation.
Risk of Loss: You may lose more than your initial capital due to the leveraged nature of futures. You are fully responsible for any losses incurred.
Market Volatility: Crypto prices can fluctuate significantly due to factors such as market sentiment, regulations, or unforeseen events.
Leverage Risk: The use of leverage can amplify profits but also increases the risk of total loss.
Regulatory Uncertainty: Regulations related to cryptocurrencies vary by jurisdiction and may change, affecting the value or legality of trading.
Technical Risks: Platform disruptions, hacking, or technical issues may result in losses.
This information is not financial, investment, or trading advice. Consult a professional financial advisor before making decisions. We are not liable for any losses or damages arising from cryptocurrency futures trading.
Note: Ensure compliance with local regulations regarding cryptocurrency trading in your region.
thanks for like and follow @ydnldn
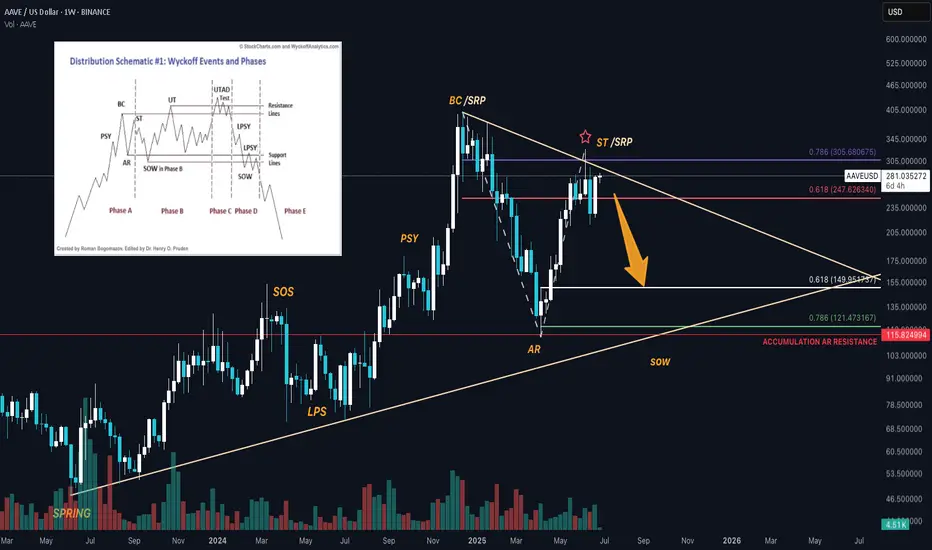
AAVE is cookedBINANCE:AAVEUSD AAVE is moving along nicely through its cycle and events. Rhyming very well with Wyckoff Distribution schematic.
Since it's buying climax it has dipped to print an AR (Automatic Rally) and is now printing in a ST (Secondary Test) zone.
A shooting star through the 0.786 printed earlier this month; a major clue that this area is exhausted and may be ready for a retracement to the down side. Currently there is a SRP (Shake-out Reversal Pattern) printing before making it's next HTF move.
A "come-back" can be expected with this asset to later print a UT/UTAD (slightly higher high); considering its strength.
The lower demand line may prove to be adequate support. Or, even perhaps the 1:0.618 window.
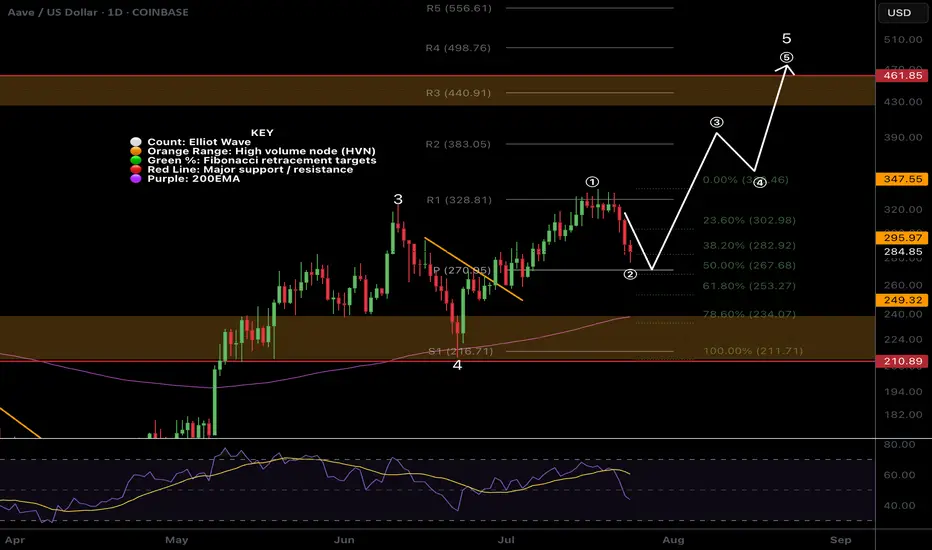
AAVE Ready For New Highs?AAVE is breaking out of its descending trendline after several tests as resistance.
Wave 2 appears complete at quadruple support: Daily 200EMA, daily pivot, .382 Fibonacci retracement and High Volume Node (HVN). If an Elliot Wave (3) of 3 is underway, price should move strongly sooner rather than later with extended price action.
The next major resistance and partial take profit is at the December swing high range $460.
Analysis is invalidated below $210.
Safe trading
AAVE Standing out among the alt coins!CRYPTOCAP:AAVE is looking stronger than most for now. Local analysis has broken the bullish market structure on what appears to be a textbook Elliot Wave 1.
Price is testing quadruple support: Daily 200EMA, daily pivot, major support High Volume Node (HVN) and the 0.382-0.5 Fib retracements. This should be a tough nut to crack (as long as CRYPTOCAP:BTC doesn't dump hard).
Wave 2 retracement's are usually deep and come with a strong fear. It is where most retail investors capitulate only to find price turns around and continues bullishly without them in a aggressive wave 3.
Analysis is invalidated below $111, so quite a ways off yet.
If war escalation continue, irrational investor behaviour will likely break this technical analysis.
Safe trading.
Scaling back into $AAVE – 3x Leverage Setup📍Entry zone: $250 → $240 (scaled)
📍Support confluence:
• Daily Supertrend touch
• Rising trendline support
• Major horizontal level near $240
🛑 Stop Loss:
• 5% price move (→ $232.75 avg) = 15% capital loss at 3x
• Or Daily Supertrend flip (closes in ~9 hours)
🎯 TP1: $295 (trim 33%)
🎯 TP2: $372 (full exit)
⚖️ R/R Ratio: 8.29
• ✅ Reward: +124%
• ❌ Risk: -15%
Just booked +133% on the last one. Back in—structure’s still bullish until it’s not.
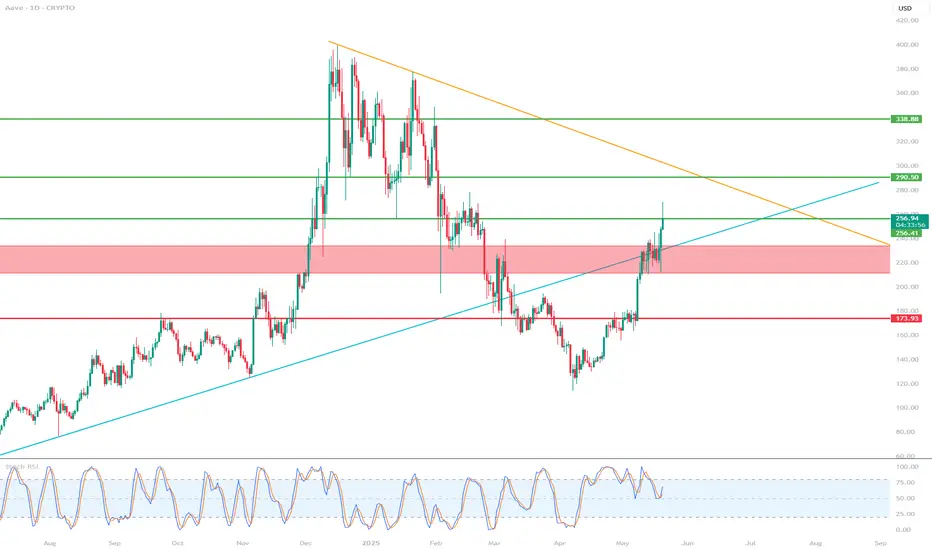
AAVEUSD 1D ChartHello everyone, I invite you to review the current situation of AAVE in the USD pair. When we enter the one-day interval, we can see how the AAVE price will see a return above the main upward trend line, but here we can see that we are still below the formed downward trend line, which in the event of further increases may prove to be a strong resistance.
Here we can see how the current rebound is fighting the resistance at $ 256, only when the level is positively tested, resistance will be still visible at the price of $ 290, this will be a strong resistance right next to the downward trend line, only a positive exit from the top and staying above this trend line can lead to movement towards resistance at $ 339.
Looking the other way, we can see that when the trend reverses, we first have a support zone from $ 233 to $ 211, however, if this zone is broken, we can see a quick return of the price to the support area at $ 174.
The Stoch RSI indicator shows that despite the current upward movement, there is still room for the upward movement to continue.
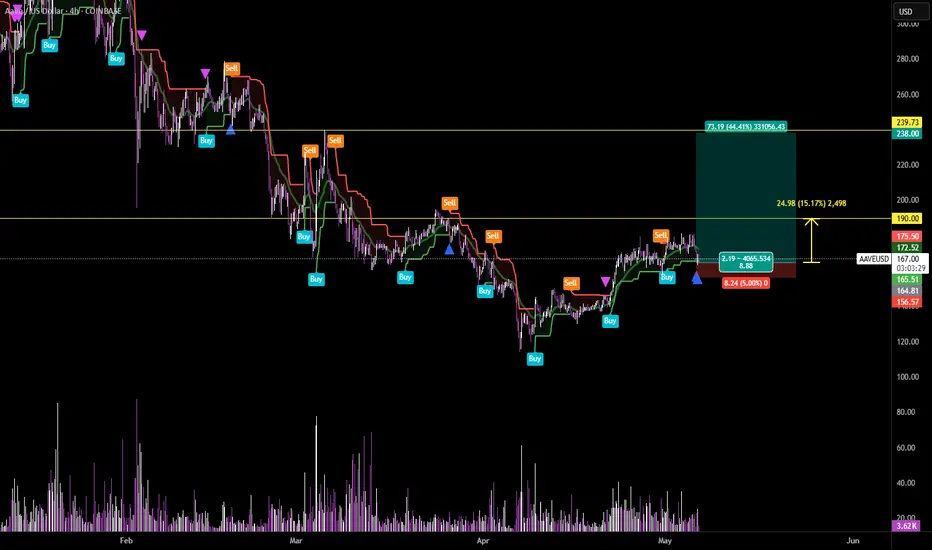
Long AAVE/USDT – Supertrend Touch Play (4H Chart)Entered a long after price tapped the 4H Supertrend and held above the EMA. Clean reaction at confluence support with prior breakout structure acting as a floor.
🎯 Targeting $238 (44.41% upside)
🛑 Stop at $158.65 (-5%)
🟢 Risk-Reward: 8.88R
⚡️ Entry: $166.89
📍 TP1: $190 (local resistance / range high reclaim)
📍 TP2: $238 (full expansion target)
Let’s see if this touch leads to the next leg up or gets faded like the last high. Risk defined, setup clean. Let the market do the rest.
#Crypto #AAVE #TradingView #Supertrend #TA #LeveragePilot #Altcoins #EMA23 #TrendTrading
Long setup on AAVE📈 Funding rate is rebounding strongly → bullish sentiment returning, no overheating signs.
📊 Open Interest is rising again after a flush → healthy new market engagement.
⚖️ Top Traders Long/Short Ratio around 1.9 → slightly bullish but still neutral, no extreme greed.
🛒 Spot CVD shows a strong rebound → real spot buyers stepping in (very bullish).
📉 Futures CVD starts recovering slowly → futures are expected to follow the spot trend.
🔥 Kingfisher Data shows heavy short positioning → potential for a powerful short squeeze.
Conclusion:
✅ Confirmed entry after alignment across Open Interest, CVD, Funding, and Long/Short Ratio.
✅ Monitoring Open Interest and CVD for squeeze confirmation.
✅ Managing the position with a tight stop below local structure to minimize risk.