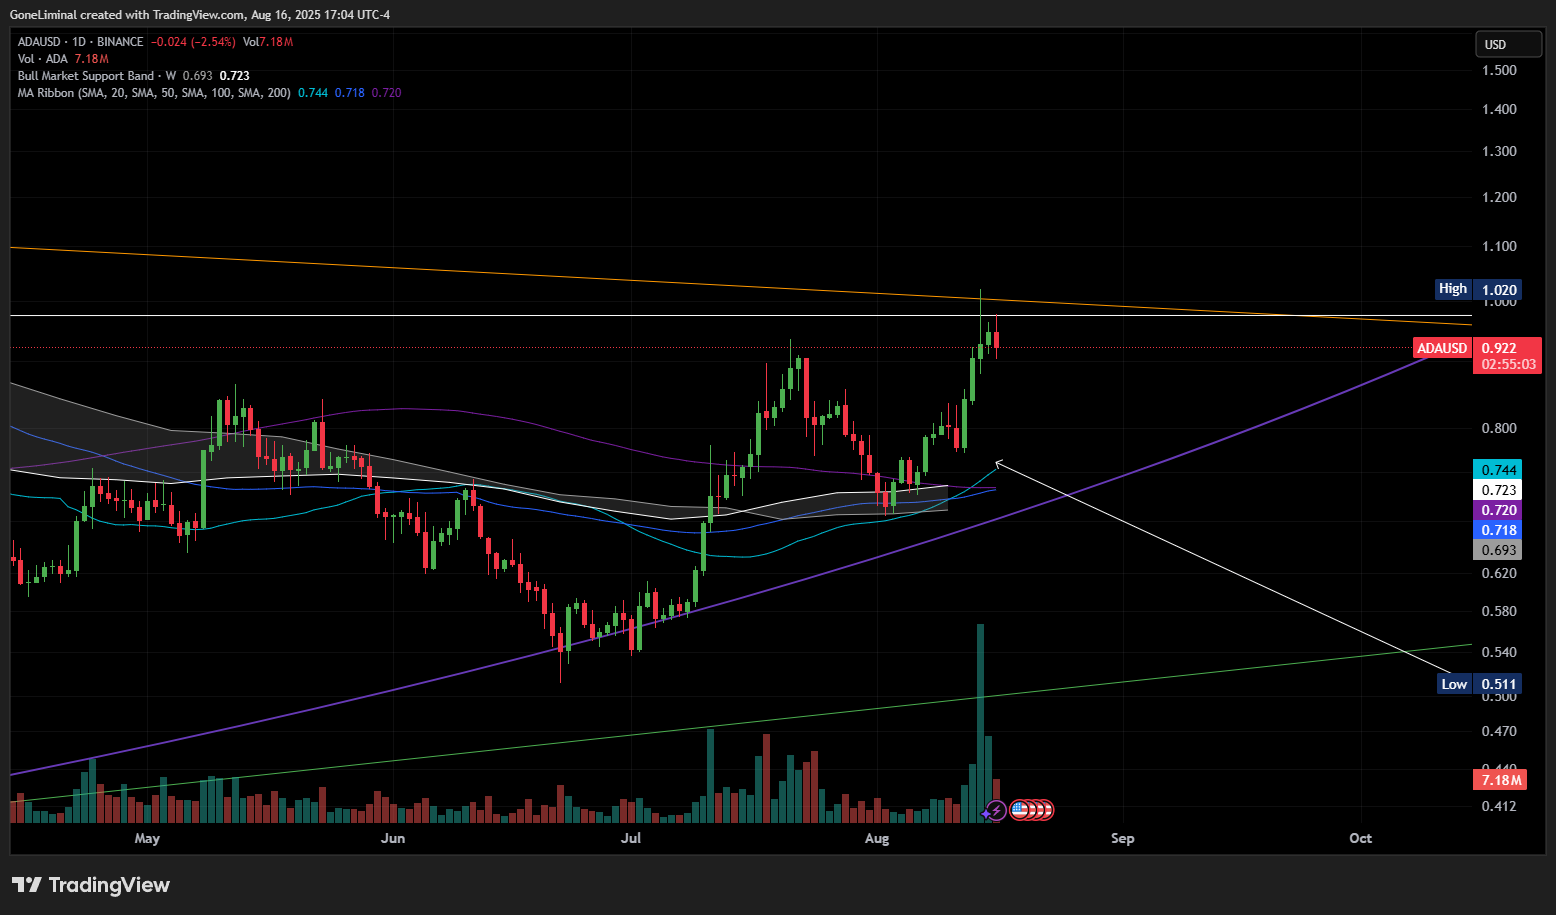
ADAUSD Daily Chart shows the confluence of two resistance areas. resistance from the previous 2021 peak(orange, descending pattern) and the 2017 Peak (White locked to peak price in 2017)
ADA has clearly reacted to bot resistance areas, First as we pushed to $1.02 and corrected(orange) and secondly as we moved to breach the $1.00 but faced resistance at $0.975
Once ADA can break these resistance areas and confirms a retest of the descending resistance (orange $1.00) we should see the 100 Daily SMA (dark blue)cross the 200 Daily SMA (purple)
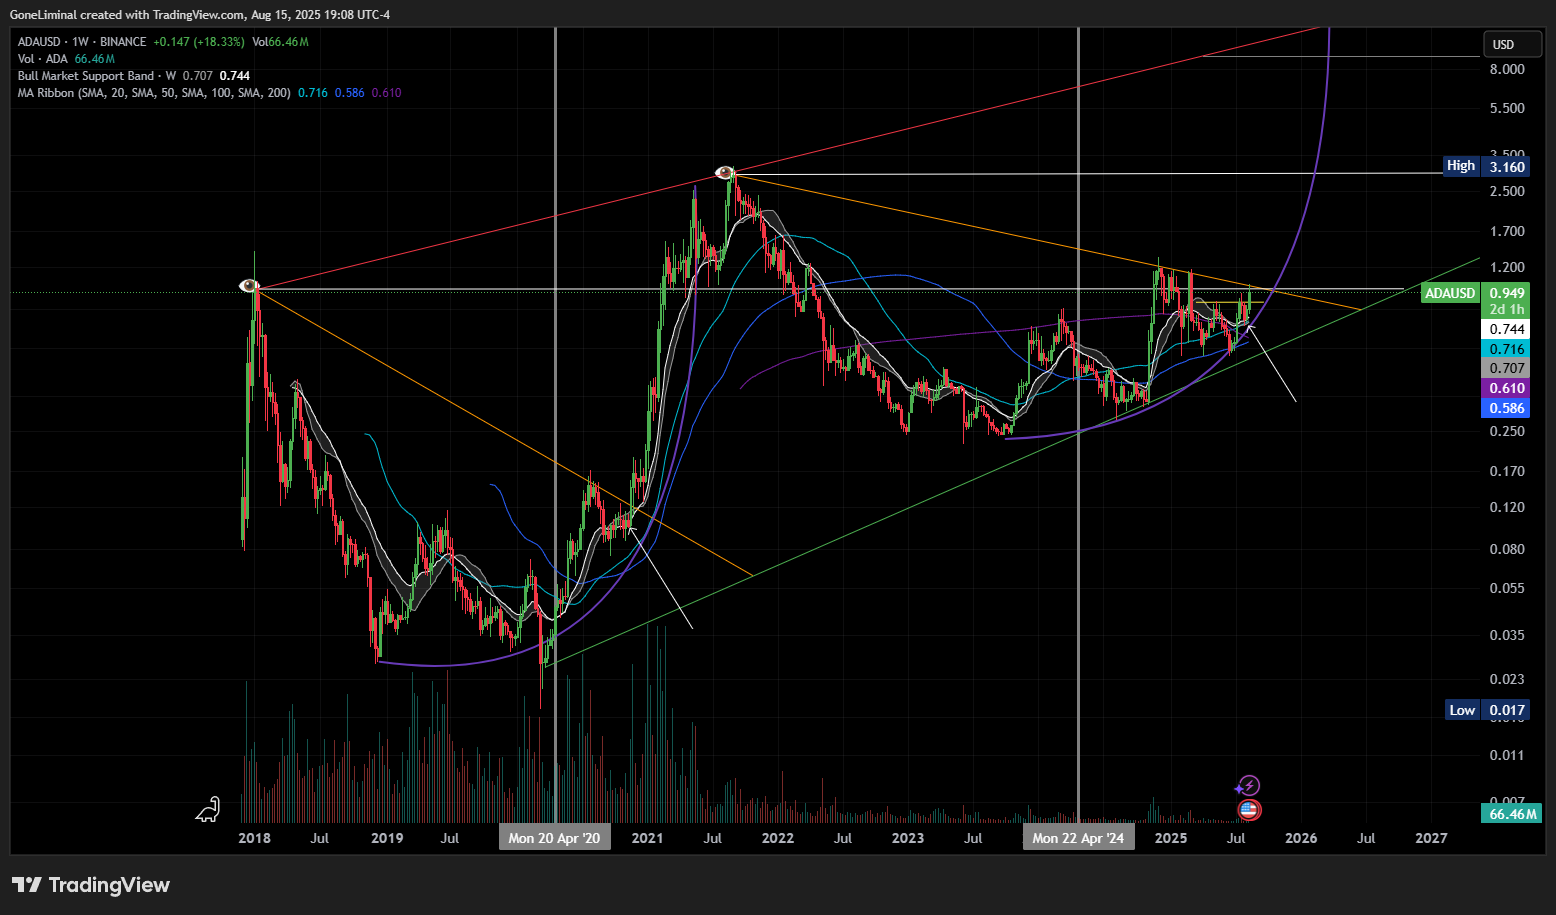
(on my previous posts weekly timeframe) as well as the 100 week (dark blue) cross the 200 week SMA (purple) for a powerful move to $1.50 and beyond.
I will be looking for ADA to complete a C&H pattern at the ATH level before moving higher.
ADAUSD price action, by my assessment is about 9 months later than last cycle, To me this is bullish as the crypto industry is getting legal clarity and institutional adoption, causing things to slow down. this is IMO creating a stronger foundation for a Yuge move. {check white arrows, which are my comparison of where we are today and last cycle.} ADAUSD
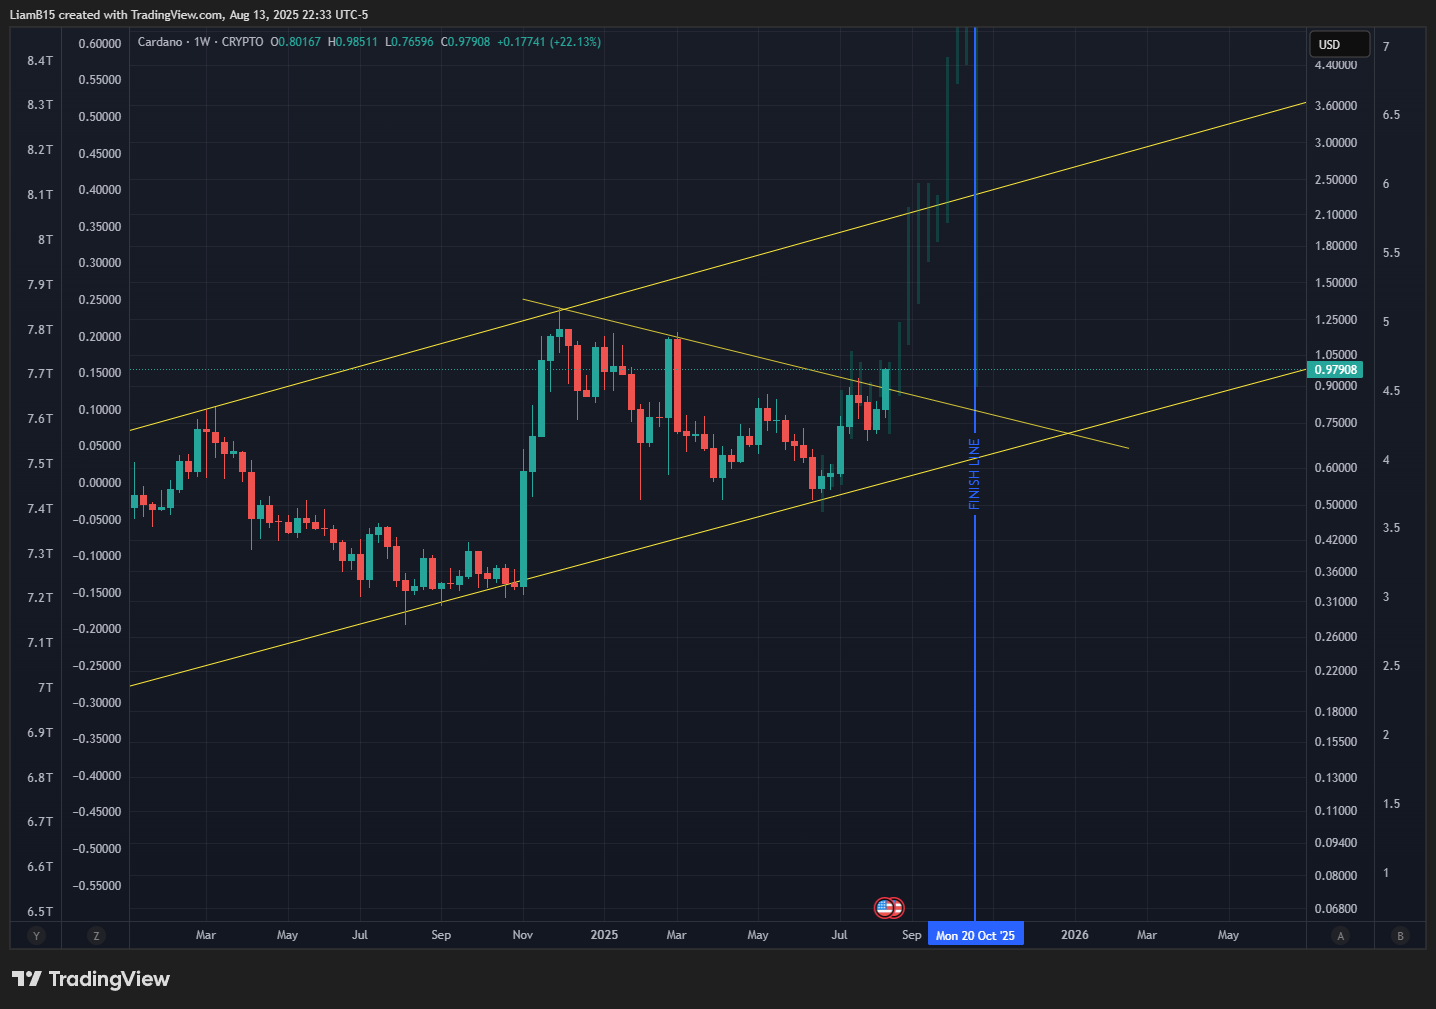
ADAUSD we touched 1.01 already before September. then its safe to say we are really going to break 1.32 previous high and leave it. We are going up much higher. $1.4+
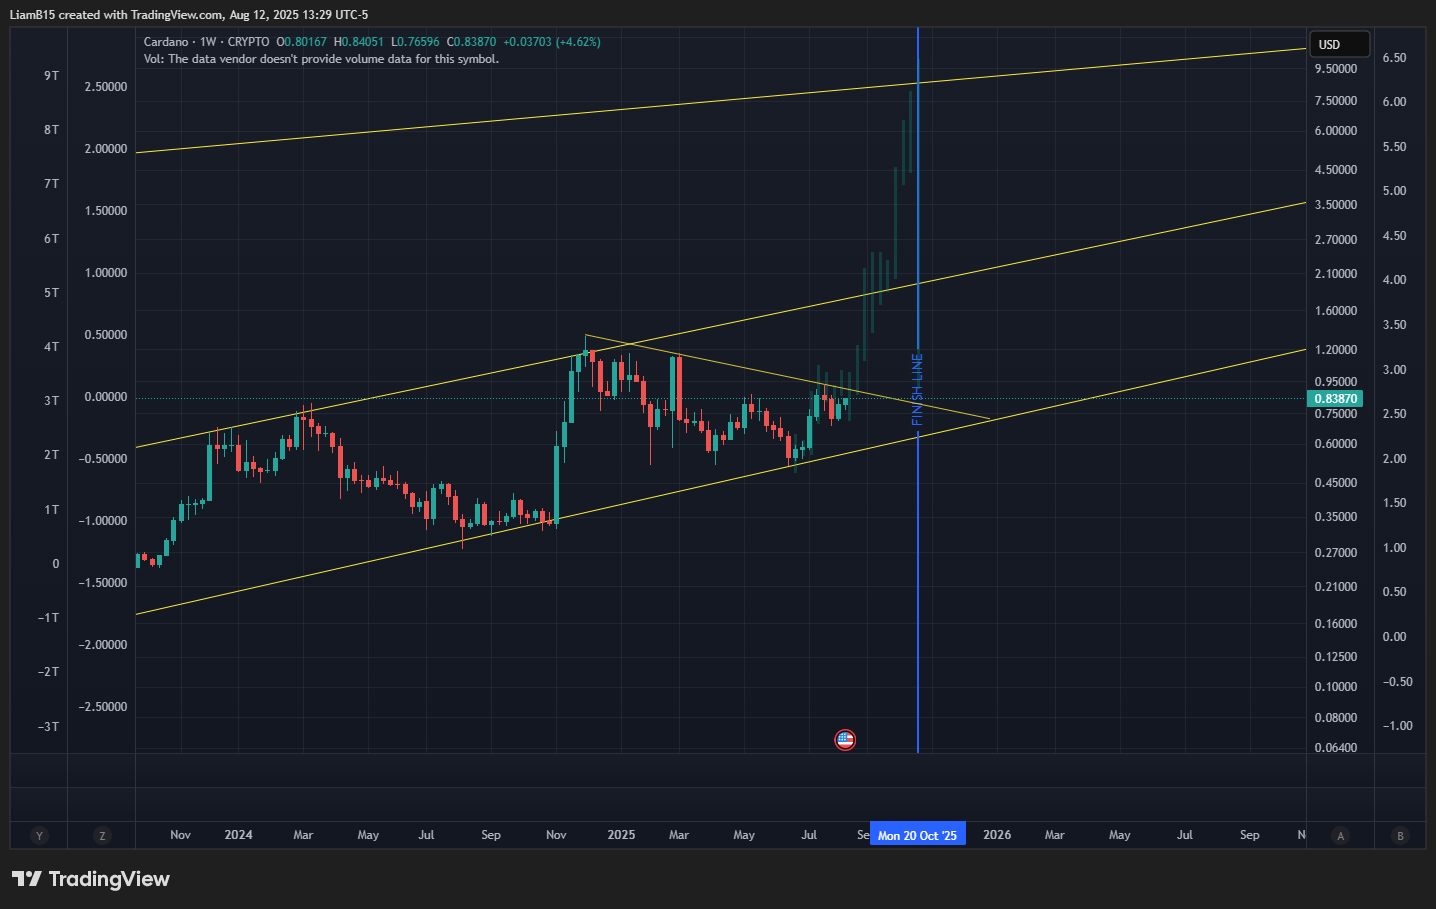
ADAUSD Check my previous post. I called this playing out a few weeks ago. We may still be on track to hit $1.80 by the end of the month. Hopefully we will be in the 1-1.50 range in the next week or two.