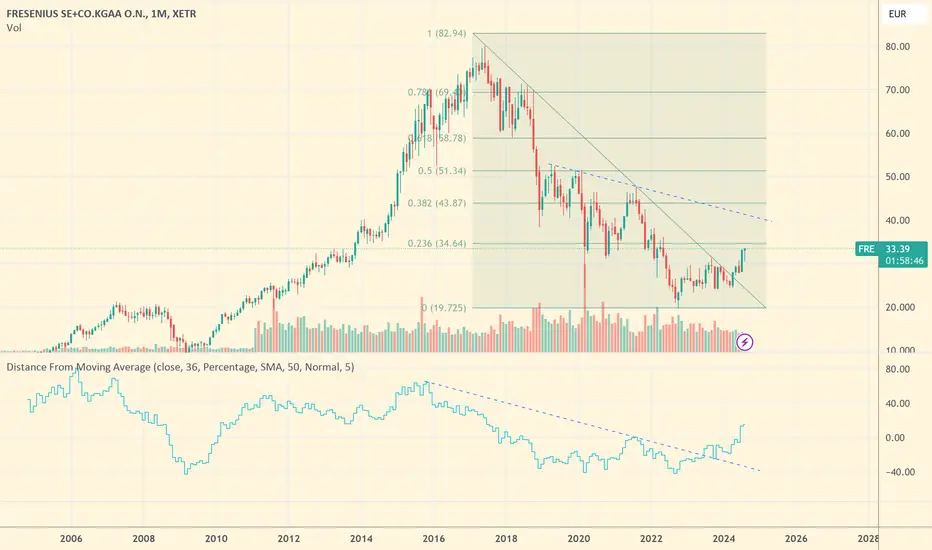
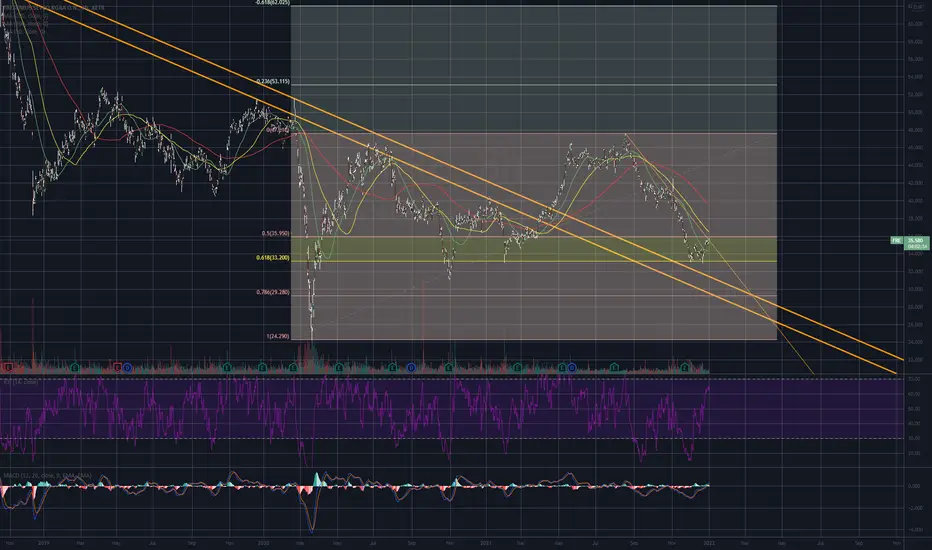
FreseniusGood monthly setup for Fresenius. Broke up descending channel, then confirmed. Now we have beautiful monthly candle giving probabilities for an upside move (hopefully above 34.60). The 3 years distance from MA shows almost the same (broke up, retest, now moving).
Very clear Fibonacci resistances a
Next report date
—
Report period
—
EPS estimate
—
Revenue estimate
—
0.75 EUR
471.00 M EUR
21.83 B EUR
411.39 M
About FRESENIUS SE+CO.KGAA O.N.
Sector
Industry
CEO
Michael Sen
Website
Headquarters
Bad Homburg
Founded
2011
ISIN
DE0005785604
FIGI
BBG00NL2SF25
Fresenius SE & Co. KGaA is a healthcare group, which engages in the provision of products and services for dialysis, hospitals, and outpatient medical care. It operates through the following segments: Fresenius Medical Care, Fresenius Kabi, Fresenius Helios and Fresenius Vamed. The Fresenius Medical Care segment caters to individuals with renal diseases. The Fresenius Kabi segment specializes in lifesaving medicines and technologies. The Fresenius Helios offers expertise in inpatient and outpatient care as well as in telemedicine. The Fresenius Vamed segment manages projects and services for hospitals and other healthcare facilities. The company was founded by Eduard Fresenius on October 1, 1912 and is headquartered in Bad Homburg, Germany.
Related stocks
FRE Mean Reversion ShortRally has moved to range-bound market on weekly chart since September 24. RSI near 70 on the daily, and although MACD looks slightly bullish, volume behind this latest move towards the upper channel line doesn't seem strong enough.
Short position near channel line with a tight stop (c. 1.0x ATR). T

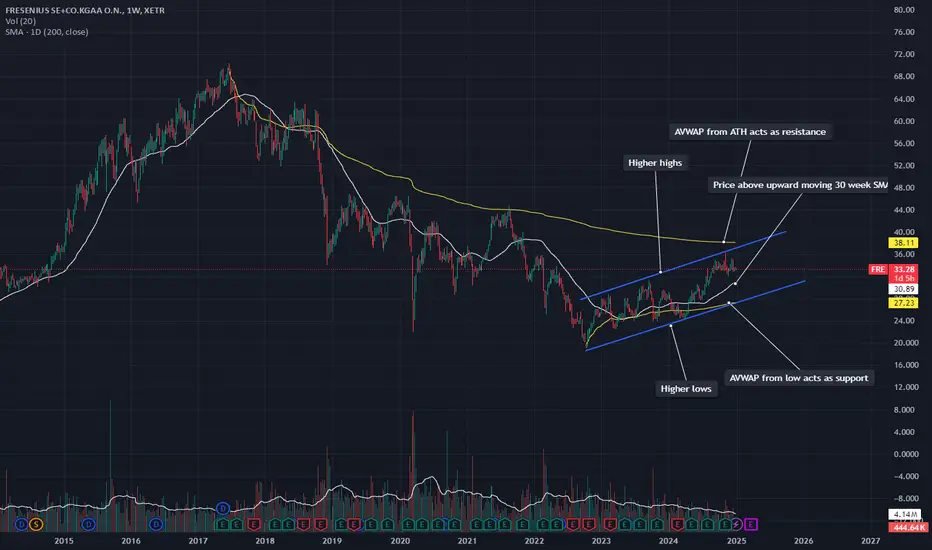
FRE a buy in 2025Not a buy yet but on my watchlist. Pattern of higher highs and higher lows with rising 200 day SMA seems favorable. However, stock is in consolidation for a few weeks and i would not wonder if it pulls back below 200 day SMA in the short-term.
Fresenius (FRE.de) bearish scenario:The technical figure Channel Up can be found in the daily chart in the German company Fresenius SE & Co. KGaA (FRE.de). Fresenius SE & Co. KGaA is a European multinational healthcare company. It provides products and services for dialysis in hospitals and inpatient and outpatient medical care. It is
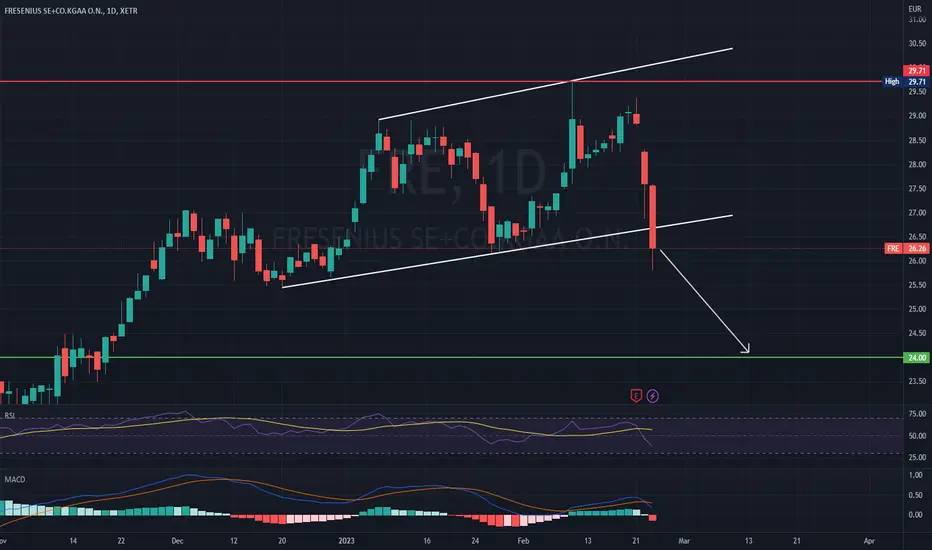
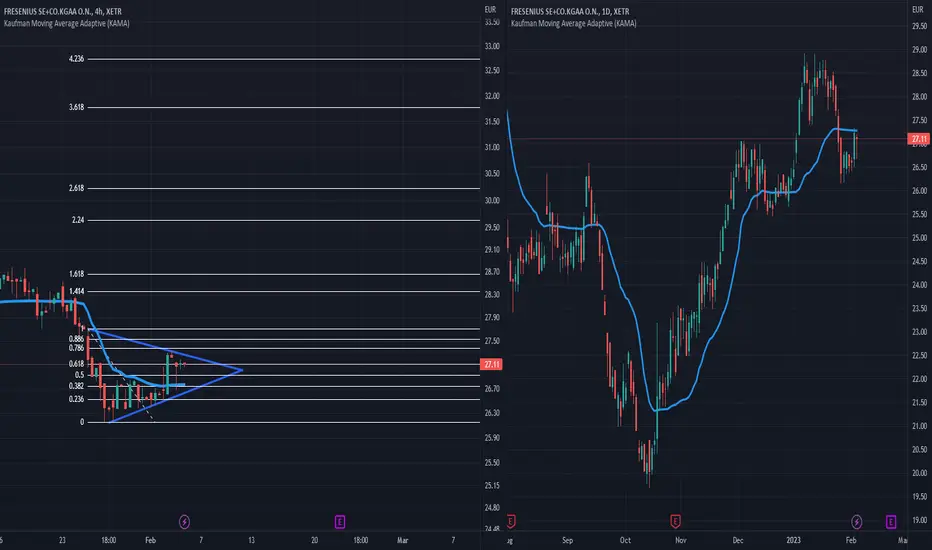
FRE // Triangle patternThe triangle needs to be broken to the upside for the formation. Pay attention to the wedge resistance on the daily timeframe.
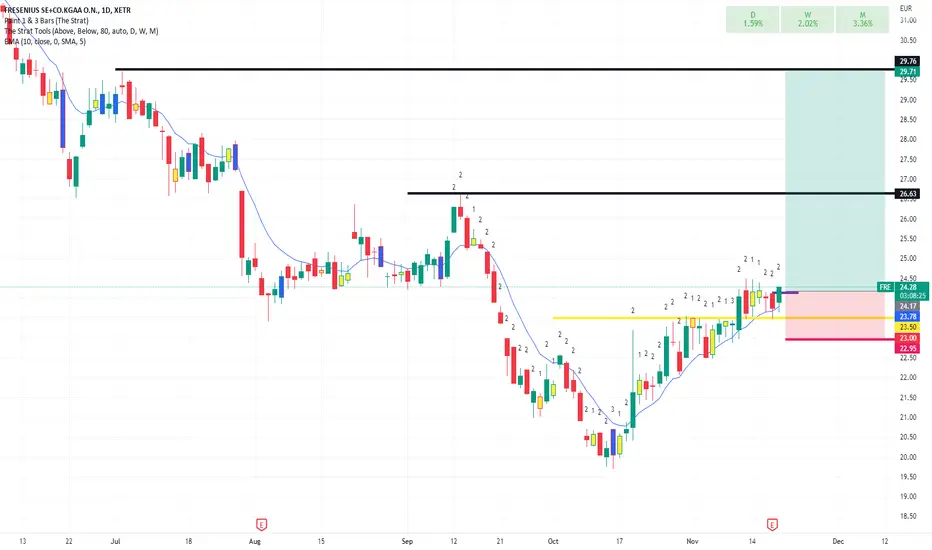
#FRE Long ideaHello dear Traders,
Here is my idea for #FRE
Price closed above yellow line (previous month high)
Price closed (15min Chart) above purple trigger line to enter trade.
Targets marked in the chart (black lines)
Invalidation level marked with red line
Good luck!
❤️Please feel free to ask any question
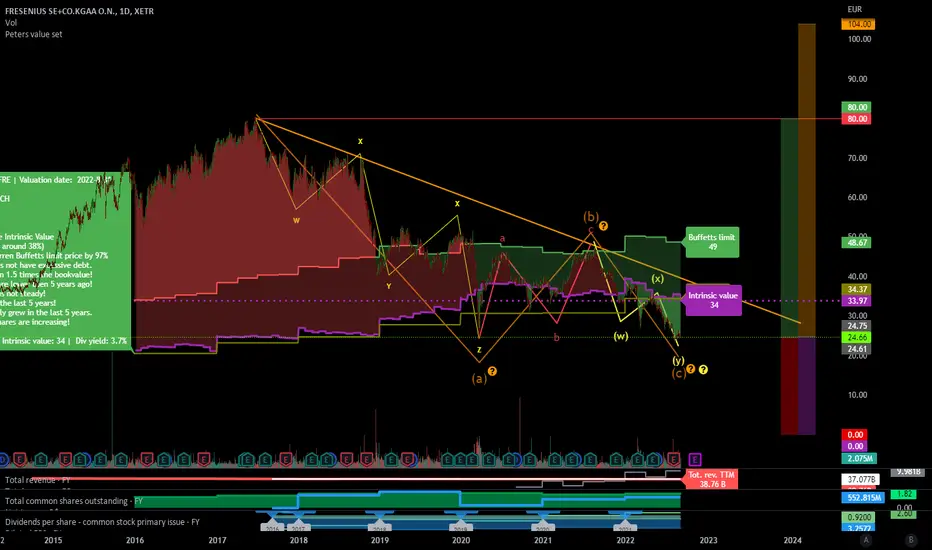
not so clear title that describes the idea .... further researchnot so clear title that discribes the idea .... further research
Fresenius ready to go!Hello altogether!
Fresenius looks ready to go up.
- We roughly tested the previous long-term descending trendline (care!: maybe this was not the test we want to see and we will come back and really test it!)
- The short-term descending trendline is broken
- Our fibo level held nicely
We are enteri
FRE w24 2021. Wait for clear uptrend.Weekly
Consolidation in downtrend
No Divergency
Price above criticial level of 50.
Will test and if break will up to 100.
Daily
Range
Weak power of trend = will continue range
Only if price will break and confirm 50 then buy
Open 50
SL 45
TP 80
RR 4
I expect it as very long trade. If you look

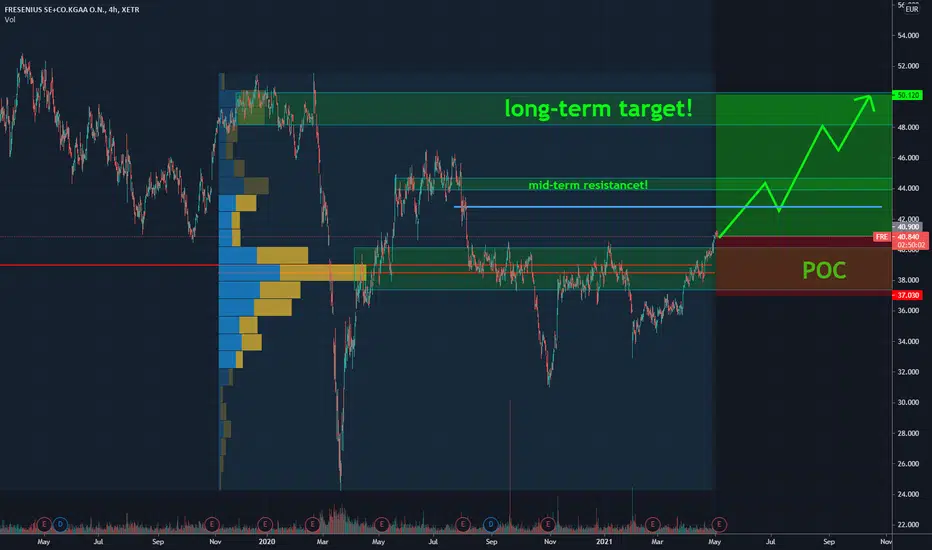
Trading Idea - #Fresenius SEBUY
ENTRY: 40.85 EUR
TARGET: 50.00 EUR (+22%)
STOP: 37.00 EUR
1.) Fresenius is breaking out of the POC box (Point of Control/Point of Interest). Technicall, an upward movement is expected.
2.) 42.80 EUR level needs to fall, so that an attack on the mid-term resistance (44.00 EUR) can occure.
3.)
See all ideas
An aggregate view of professional's ratings.
Neutral
SellBuy
Strong sellStrong buy
Strong sellSellNeutralBuyStrong buy
Neutral
SellBuy
Strong sellStrong buy
Strong sellSellNeutralBuyStrong buy
Neutral
SellBuy
Strong sellStrong buy
Strong sellSellNeutralBuyStrong buy
Displays a symbol's price movements over previous years to identify recurring trends.
Frequently Asked Questions
Depending on the exchange, the stock ticker may vary. For instance, on AQUISEU exchange Fresenius SE and Co KGaA stocks are traded under the ticker FRED.
We've gathered analysts' opinions on Fresenius SE and Co KGaA future price: according to them, FRED price has a max estimate of 53.00 EUR and a min estimate of 42.00 EUR. Watch FRED chart and read a more detailed Fresenius SE and Co KGaA stock forecast: see what analysts think of Fresenius SE and Co KGaA and suggest that you do with its stocks.
FRED reached its all-time high on Jun 15, 2018 with the price of 71.30 EUR, and its all-time low was 19.69 EUR and was reached on Oct 14, 2022. View more price dynamics on FRED chart.
See other stocks reaching their highest and lowest prices.
See other stocks reaching their highest and lowest prices.
Yes, you can track Fresenius SE and Co KGaA financials in yearly and quarterly reports right on TradingView.
Fresenius SE and Co KGaA is going to release the next earnings report on Aug 6, 2025. Keep track of upcoming events with our Earnings Calendar.
FRED earnings for the last quarter are 0.87 EUR per share, whereas the estimation was 0.77 EUR resulting in a 12.89% surprise. The estimated earnings for the next quarter are 0.77 EUR per share. See more details about Fresenius SE and Co KGaA earnings.
Fresenius SE and Co KGaA revenue for the last quarter amounts to 5.63 B EUR, despite the estimated figure of 5.43 B EUR. In the next quarter, revenue is expected to reach 5.42 B EUR.
FRED net income for the last quarter is 229.00 M EUR, while the quarter before that showed 240.00 M EUR of net income which accounts for −4.58% change. Track more Fresenius SE and Co KGaA financial stats to get the full picture.
Yes, FRED dividends are paid annually. The last dividend per share was 1.00 EUR. As of today, Dividend Yield (TTM)% is 2.45%. Tracking Fresenius SE and Co KGaA dividends might help you take more informed decisions.
As of Jul 21, 2025, the company has 176.49 K employees. See our rating of the largest employees — is Fresenius SE and Co KGaA on this list?
EBITDA measures a company's operating performance, its growth signifies an improvement in the efficiency of a company. Fresenius SE and Co KGaA EBITDA is 3.06 B EUR, and current EBITDA margin is 13.92%. See more stats in Fresenius SE and Co KGaA financial statements.
Like other stocks, FRED shares are traded on stock exchanges, e.g. Nasdaq, Nyse, Euronext, and the easiest way to buy them is through an online stock broker. To do this, you need to open an account and follow a broker's procedures, then start trading. You can trade Fresenius SE and Co KGaA stock right from TradingView charts — choose your broker and connect to your account.