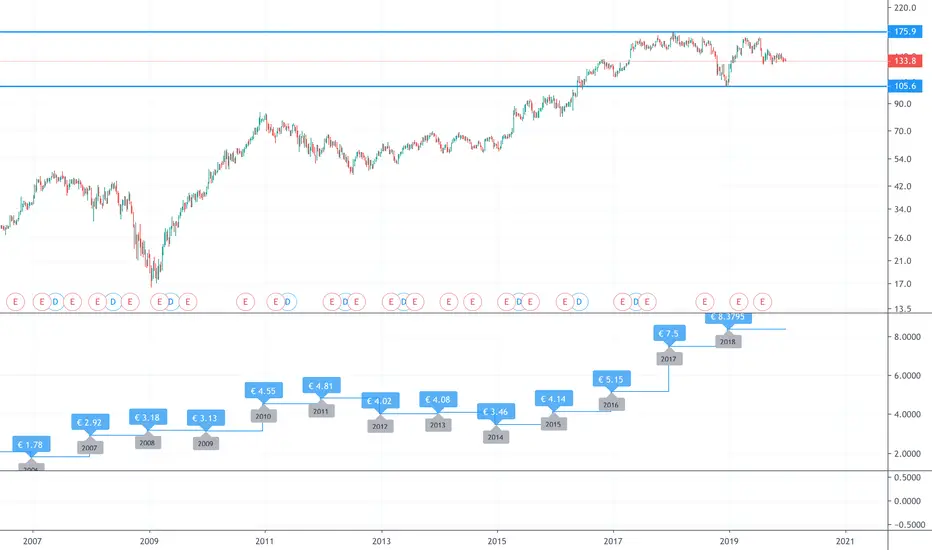
Groupe S.E.B. SA (SK.PA) of France: EPS rising.S.E.B. SA (SEB) (Symbol SK.PA), is a global supplier of Kitchen and household equipment. (White goods) Brand names include include All-Clad, Krups, Moulinex, Rowenta, Tefal and WMF Group. They make non-stick cookware, bakeware, stainless roasters, coffee machines, tea machines, juice squeezers,
Next report date
—
Report period
—
EPS estimate
—
Revenue estimate
—
4.25 EUR
232.00 M EUR
8.27 B EUR
25.38 M
About S.E.B.
Sector
Industry
CEO
Stanislas de Gramont
Website
Headquarters
Écully
Founded
1974
ISIN
FR0000121709
FIGI
BBG00F16YTB8
SEB SA engages in the manufacturing of small domestic equipment and cookware. It operates through the Consumer and Professional segments. The Consumer segment focuses on the kitchen electrics, home and personal care, and cookware. The Professional segment include coffee machines and other professional equipment. The company was founded in 1973 and is headquartered in Écully, France.
Related stocks
An aggregate view of professional's ratings.
Neutral
SellBuy
Strong sellStrong buy
Strong sellSellNeutralBuyStrong buy
Neutral
SellBuy
Strong sellStrong buy
Strong sellSellNeutralBuyStrong buy
Neutral
SellBuy
Strong sellStrong buy
Strong sellSellNeutralBuyStrong buy
Displays a symbol's price movements over previous years to identify recurring trends.
Frequently Asked Questions
Depending on the exchange, the stock ticker may vary. For instance, on AQUISUK exchange SEB SA stocks are traded under the ticker SKP.
We've gathered analysts' opinions on SEB SA future price: according to them, SKP price has a max estimate of 130.00 EUR and a min estimate of 106.00 EUR. Watch SKP chart and read a more detailed SEB SA stock forecast: see what analysts think of SEB SA and suggest that you do with its stocks.
Yes, you can track SEB SA financials in yearly and quarterly reports right on TradingView.
SEB SA is going to release the next earnings report on Jul 23, 2025. Keep track of upcoming events with our Earnings Calendar.
SEB SA revenue for the last half-year amounts to 4.53 B EUR, despite the estimated figure of 4.53 B EUR. In the next half-year revenue is expected to reach 3.76 B EUR.
SKP net income for the last half-year is 131.90 M EUR, while the previous report showed 100.10 M EUR of net income which accounts for 31.77% change. Track more SEB SA financial stats to get the full picture.
Yes, SKP dividends are paid annually. The last dividend per share was 2.80 EUR. As of today, Dividend Yield (TTM)% is 3.38%. Tracking SEB SA dividends might help you take more informed decisions.
SEB SA dividend yield was 3.20% in 2024, and payout ratio reached 65.80%. The year before the numbers were 2.32% and 37.35% correspondingly. See high-dividend stocks and find more opportunities for your portfolio.
As of Jul 10, 2025, the company has 32.24 K employees. See our rating of the largest employees — is SEB SA on this list?
EBITDA measures a company's operating performance, its growth signifies an improvement in the efficiency of a company. SEB SA EBITDA is 1.04 B EUR, and current EBITDA margin is 10.32%. See more stats in SEB SA financial statements.
Like other stocks, SKP shares are traded on stock exchanges, e.g. Nasdaq, Nyse, Euronext, and the easiest way to buy them is through an online stock broker. To do this, you need to open an account and follow a broker's procedures, then start trading. You can trade SEB SA stock right from TradingView charts — choose your broker and connect to your account.