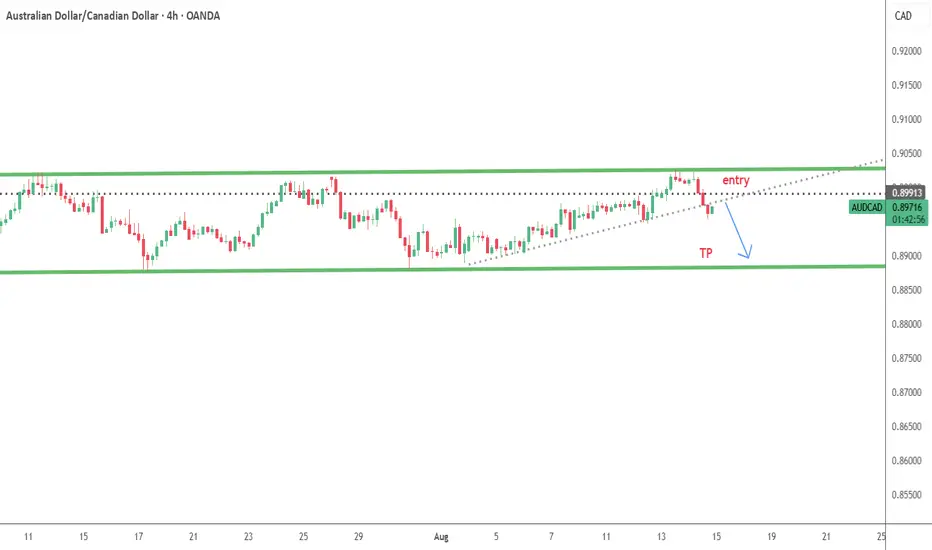
AUDCAD: Pullback From Resistance 🇦🇺🇨🇦
AUDCAD may retrace from the underlined blue resistance.
A breakout of a support line of a rising wedge pattern
after its test leaves a strong bearish clue.
We can expect a pullback to 0.8962 level.
❤️Please, support my work with like, thank you!❤️
I am part of Trade Nation's Influencer program and receive a monthly fee for using their TradingView charts in my analysis.
AUDCAD trade ideas


AUD/CAD–From Downtrend to Breakout Watch/Sideways ConsolidationAfter an extended downtrend, AUD/CAD transitioned into a sideways consolidation pattern, holding between clearly defined support and resistance levels.
Support zone: ~0.8800 – 0.8850
Resistance zone: ~0.9000 – 0.9050
Potential breakout target: 0.9200
Price is testing the upper boundary of the range, with higher lows forming, indicating a shift in market structure. Volume profile shows strong interest near the mid-range, and a sustained close above resistance could open the path toward the next major level.
Key points on the chart:
Downtrend channel breakout
Sideways accumulation phase
Higher lows supporting potential bullish momentum
This setup is for chart analysis and educational purposes only – not financial advice. Always manage risk according to your trading plan

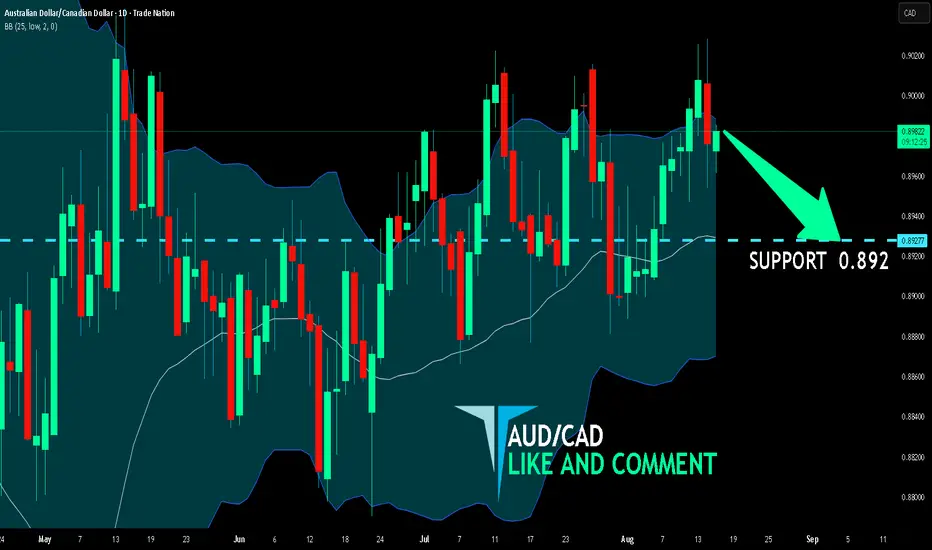
AUD/CAD SENDS CLEAR BEARISH SIGNALS|SHORT
Hello, Friends!
Bearish trend on AUD/CAD, defined by the red colour of the last week candle combined with the fact the pair is overbought based on the BB upper band proximity, makes me expect a bearish rebound from the resistance line above and a retest of the local target below at 0.892.
Disclosure: I am part of Trade Nation's Influencer program and receive a monthly fee for using their TradingView charts in my analysis.
✅LIKE AND COMMENT MY IDEAS✅
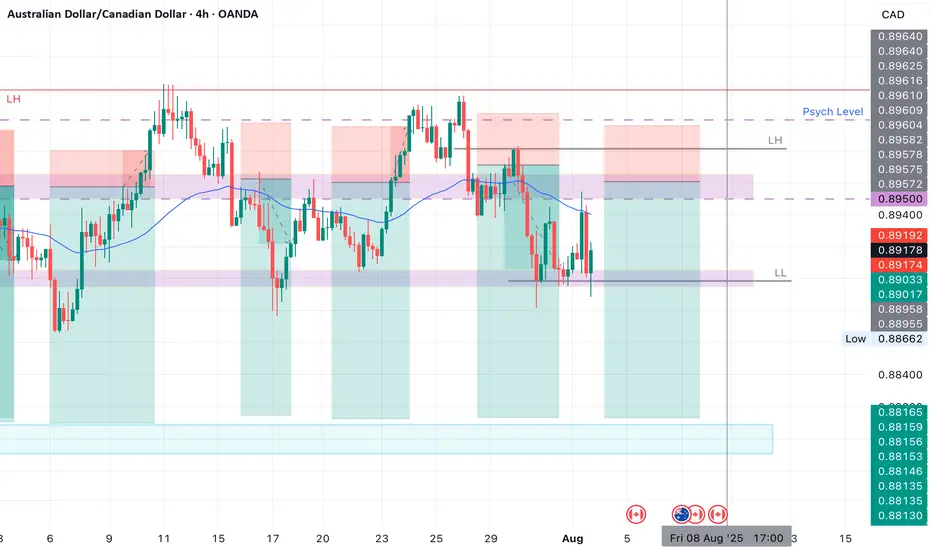
AUDCAD SHORT Market structure bearish on HTFs 3
Entry at both Daily and Weekly AOi
Weekly Rejection at AOi
Previous Weekly Structure Point
Daily Rejection at AOi
Previous Structure point Daily
Around Psych Level 0.89500
H4 Candlestick rejection
Rejection from Previous structure
Levels 4.18
Entry 120%
REMEMBER : Trading is a Game Of Probability
: Manage Your Risk
: Be Patient
: Every Moment Is Unique
: Rinse, Wash, Repeat!
: Christ is King.
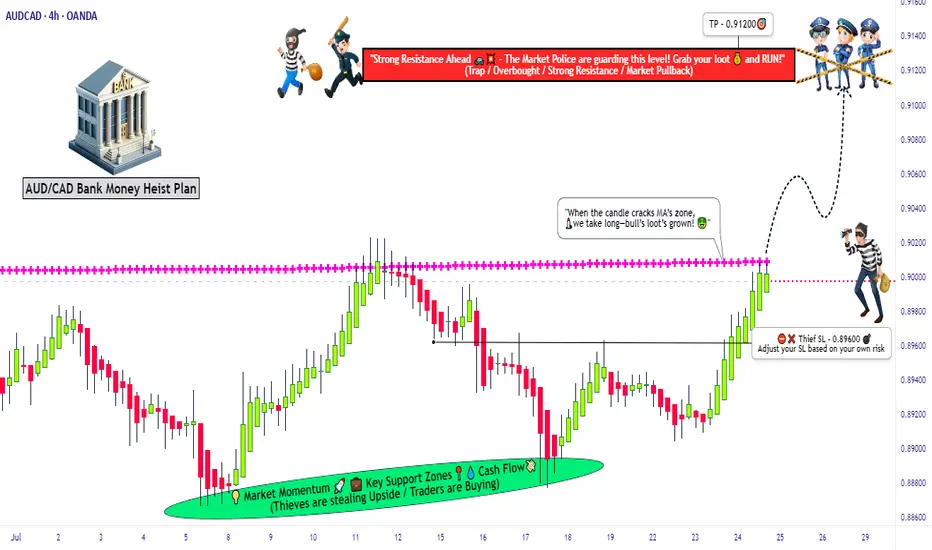
AUDCAD Forex Heist Plan: Entry, SL & TP by Thief Trader Style🏴☠️🔥 AUD/CAD Bank Heist Plan – Thief Trader's Long Con in Motion! 🔥🏴☠️
Breakout Bulls vs Bearish Guards – Who Wins the Forex Vault This Time?
🌍 Hello Money Makers, Market Bandits, and Strategic Robbers! 💰🚀💣
It’s Thief Trader back again, dropping heat with another high-stakes Forex bank job – this time we're targeting the AUD/CAD vault. This is not your grandma’s trading plan. We’re executing a well-calculated heist based on a fusion of technical breakouts + fundamental drivers with a dose of pure trading psychology warfare. 🎯
💼 The Heist Blueprint: Long Entry Game Plan
🧠 Our job is to move in silence until the breakout alarms go off.
We target 0.90200 as the clean breakout trigger over the Moving Average. This zone marks the guard shift — bulls take over if we break through.
📌 Entry Types (Choose your weapon):
🔹 Buy Stop: Above 0.90200 (Post-MA breakout confirmation).
🔹 Buy Limit (DCA Style): Set limit buys at recent lows (M15/M30 swing low) for pullback entries. Layer your entries like a true strategist.
🔔 Set Alerts: Don't sleep on this. Place alerts at breakout zones – let the chart notify you when the bank door opens. 📡
🛑 Risk Management – The Escape Plan
We don't jump in blind. Place your Stop Loss ONLY AFTER the breakout confirms.
📍Suggested SL: 0.89600, near recent 4H wick low.
🔥 Reminder: Your stop depends on your lot size, risk tolerance, and how many entries you're stacking. Don't set it too tight – we don't want early alarms killing the mission.
🎯 Profit Target – Rob & Exit
📍 Primary TP: 0.91200
🎭 Or simply: Escape before the alarm rings (i.e., close early if you see price weakness near resistance or news surprises).
🧲 Scalpers, stick to long bias only. If you're running capital deep, go in hard. If not, ride with the swing team. Use trailing SLs to protect and ride the move like a ghost.
🧠 Behind the Heist – What Fuels Our Mission?
The AUD/CAD pair is showing bullish signs backed by:
✴️ Macroeconomic indicators
✴️ Central Bank divergences
✴️ COT data (Commitment of Traders)
✴️ Intermarket correlations
✴️ Sentiment shifts & positioning strategies
Before executing any trade, read your fundamentals. Study the landscape. Then strike. 🕵️♂️
⚠️ Trading Safety Alert – Timing Is Everything
🚫 Avoid placing trades during high-impact news.
✅ Use trailing SL to lock in profits and prevent whipsaw hits.
📊 Protect your capital like it’s stolen loot – because it is!
💥Support the Crew 💥
🚀 Smash that 💗 Boost Button if you’re vibing with the plan.
Every like strengthens the Thief Trading Crew – and gets us closer to daily market domination. 🎉💪
📲 Stay locked in. Another heist is coming soon.
Till then – rob smart, trade sharp, and vanish like a legend. 🐱👤💸
🔑 #AUDCAD #ThiefTrader #ForexBreakout #LongSetup #ScalpToSwing #TradeWithPlan #DCAEntry #ForexHeist #MarketStrategy #RiskReward
AUDCAD SellsAUDCAD price is nearing an are of interest. A rising support structure has been established and price may retest the support once more before the end of today
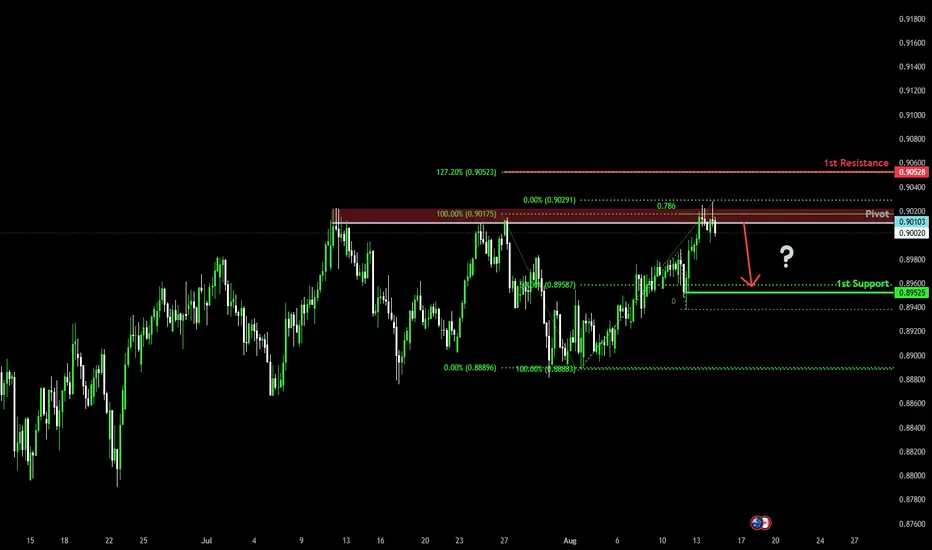
Bearish reversal?AUD/CAD is reacting off the pivot which has been identified as a multi swing high resistance that lines up with the 78.6% Fibonacci projection and could drop to the 1st support, which acts as a pullback support that aligns with the 50% Fibonacci retracement.
Pivot: 0.90103
1st Support: 0.89525
1st Resistance: 0.90528
Risk Warning:
Trading Forex and CFDs carries a high level of risk to your capital and you should only trade with money you can afford to lose. Trading Forex and CFDs may not be suitable for all investors, so please ensure that you fully understand the risks involved and seek independent advice if necessary.
Disclaimer:
The above opinions given constitute general market commentary, and do not constitute the opinion or advice of IC Markets or any form of personal or investment advice.
Any opinions, news, research, analyses, prices, other information, or links to third-party sites contained on this website are provided on an "as-is" basis, are intended only to be informative, is not an advice nor a recommendation, nor research, or a record of our trading prices, or an offer of, or solicitation for a transaction in any financial instrument and thus should not be treated as such. The information provided does not involve any specific investment objectives, financial situation and needs of any specific person who may receive it. Please be aware, that past performance is not a reliable indicator of future performance and/or results. Past Performance or Forward-looking scenarios based upon the reasonable beliefs of the third-party provider are not a guarantee of future performance. Actual results may differ materially from those anticipated in forward-looking or past performance statements. IC Markets makes no representation or warranty and assumes no liability as to the accuracy or completeness of the information provided, nor any loss arising from any investment based on a recommendation, forecast or any information supplied by any third-party.
AUDCAD SHHORTS Documentation Market structure 3
At AOI DW
Touching EMA W
Candlestick rejection DW
Previous Structure point DW
Round Psych Level 0.90000
Touching EMA Y
H4 Candlestick rejection Y
Rejection from Previous structure Y
Levels 4.75
Entry 125%
Trade executed but was not posted on TV, Documenting for future me
REMEMBER : Trading is a Game Of Probability
: Manage Your Risk
: Be Patient
: Every Moment Is Unique
: Rinse, Wash, Repeat!
: Christ is King.
AUDCAD; Heikin Ashi Trade IdeaIn this video, I’ll be sharing my analysis of AUDCAD, using FXAN's proprietary algo indicators with my unique Heikin Ashi strategy. I’ll walk you through the reasoning behind my trade setup and highlight key areas where I’m anticipating potential opportunities.
I’m always happy to receive any feedback.
Like, share and comment! ❤️
Thank you for watching my videos! 🙏

Potential bearish drop?AUD/CAD is reacting off the resistance level, which is a pullback resistance, and could drop from this level to our take-profit.
Entry: 0.89386
Why we like it:
There is a pullback resistance.
Stop loss: 0.8980
Why we like it:
There is a pullback resistance.
Take profit: 0.8866
Why we like it:
There is a swing low support.
Enjoying your TradingView experience? Review us!
Please be advised that the information presented on TradingView is provided to Vantage (‘Vantage Global Limited’, ‘we’) by a third-party provider (‘Everest Fortune Group’). Please be reminded that you are solely responsible for the trading decisions on your account. There is a very high degree of risk involved in trading. Any information and/or content is intended entirely for research, educational and informational purposes only and does not constitute investment or consultation advice or investment strategy. The information is not tailored to the investment needs of any specific person and therefore does not involve a consideration of any of the investment objectives, financial situation or needs of any viewer that may receive it. Kindly also note that past performance is not a reliable indicator of future results. Actual results may differ materially from those anticipated in forward-looking or past performance statements. We assume no liability as to the accuracy or completeness of any of the information and/or content provided herein and the Company cannot be held responsible for any omission, mistake nor for any loss or damage including without limitation to any loss of profit which may arise from reliance on any information supplied by Everest Fortune Group.

Bearish drop?AUD/CAD has rejected off the resistance level whihc is a pullback resistance and could drop from this level to our take profit.
Entry: 0.89386
Why we like it:
There is a pullback resistance.
Stop loss: 0.89800
Why we like it:
There is a pullback resistance.
Take profit: 0.88661
Why we like it:
There is a swing low support.
Enjoying your TradingView experience? Review us!
Please be advised that the information presented on TradingView is provided to Vantage (‘Vantage Global Limited’, ‘we’) by a third-party provider (‘Everest Fortune Group’). Please be reminded that you are solely responsible for the trading decisions on your account. There is a very high degree of risk involved in trading. Any information and/or content is intended entirely for research, educational and informational purposes only and does not constitute investment or consultation advice or investment strategy. The information is not tailored to the investment needs of any specific person and therefore does not involve a consideration of any of the investment objectives, financial situation or needs of any viewer that may receive it. Kindly also note that past performance is not a reliable indicator of future results. Actual results may differ materially from those anticipated in forward-looking or past performance statements. We assume no liability as to the accuracy or completeness of any of the information and/or content provided herein and the Company cannot be held responsible for any omission, mistake nor for any loss or damage including without limitation to any loss of profit which may arise from reliance on any information supplied by Everest Fortune Group.

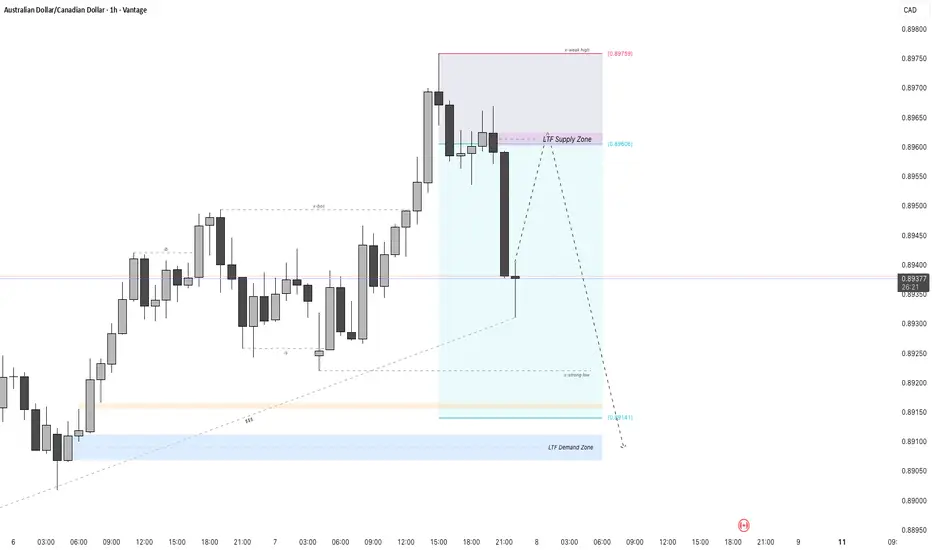
AUDCAD - 1H Chart Using Smart Money ConceptsThis trading plan follows the Smart Money Concept (SMC) methodology, emphasizing institutional price behavior to anticipate potential market moves.
Market Context:
The price recently experienced a strong bearish move from a Higher Time Frame (HTF) Supply Zone around 0.8960, leading to a sharp decline. The current price is at a potential support area near a previous Order Block located around 0.8940.
Major Zones:
LTF Supply Zone (0.8960 region): This is a significant resistance area where institutional sellers previously entered, causing the strong downward move. A retest of this zone could provide a high-probability short setup if price rallies back here.
LTF Demand Zone (around 0.8914): This is a strong support area indicated by the chart that may act as a buyer accumulation zone.
Price Action & Structure:
The chart shows key Smart Money Concept structures including:
Order Blocks (OB): Areas where institutions likely placed orders before strong price moves.
Break of Structure (BOS): Recent bearish structure break confirms a shift in momentum downward.
Trading Bias and Plan:
The plan considers a bearish continuation bias after a potential retracement.
Traders should watch for price to retrace up towards the LTF Supply Zone (the identified resistance zone) before entering short positions. This retracement offers an opportunity to enter with better risk to reward near institutional selling areas.
Confirmation signals like rejection candles or liquidity tests at the supply zone enhance the setup validity.
If the supply zone fails to hold and price breaks higher, the scenario invalidates and traders should reassess.
Targets and Risk Management:
Initial targets can be set near the LTF Demand Zone and further below near strong lows identified on the chart.
Protective stop losses should be placed above the supply zone or above recent swing highs to minimize risk from false breakouts.
How many reasons do you need to take the trade?All the information you need to find a high probability trade are in front of you on the charts so build your trading decisions on 'the facts' of the chart NOT what you think or what you want to happen or even what you heard will happen. If you have enough facts telling you to trade in a certain direction and therefore enough confluence to take a trade, then this is how you will gain consistency in you trading and build confidence. Check out my trade idea!!
tradingview.sweetlogin.com

DAILY AUDCAD SELL IDEA 📍AUDCAD Market Breakdown – ABC Setup in Play
Right now, AUDCAD is showing signs that we’ve entered the B to C leg of our ABC framework.
We had a clean consolidation phase that transitioned into a decisive expansion, textbook market behavior that aligns with the buildup and breakout principles we teach. That expansion gave us our possible “B” point, and now we’re seeing the retracement phase unfold which is the real gem for Snipress-style execution.
Price action has now tapped into a key level we’ve been watching for high-quality continuation shorts. The structure is aligning:
✔️ We’ve got the retracement
✔️ Price is reacting to a prior supply zone
✔️ Momentum is slowing near the level, a sign we may be gearing up for the “C to completion” leg
This is not the time to guess, it’s time to observe, confirm, and strike when the candle gives permission. Let the trade come to you. Stay sniper-minded. 🧠🔫

AUDCAD Wave Analysis – 14 August 2025
- AUDCAD reversed from the round resistance level of 0.9000
- Likely to fall to support level 0.8900
AUDCAD currency pair recently reversed from the round resistance level of 0.9000 (which has been steadily reversing the price from the start of May).
The resistance zone near the resistance level of 0.9000 was strengthened by the upper daily Bollinger Band and by the 61.8% Fibonacci correction of the downward impulse from October.
AUDCAD currency pair can be expected to fall to the next support level 0.8900, which has reversed the pair from the start of July.

AUDCAD TRADE IDEA AUDCAD did it's thing and we're out in full TP.
We had a pullback to our Fibonacci level...
Our OB was tapped into

AUDCAD Short OpportunityShort limit order placed here, we are over bought on the oscillators (RSI, STOCH ETC) and we are entering an area of interest for for shorts. We will target a TP just above the where liquidity pooled to push price up. If price moves against us, I will add new entry every 4 hour candle we are pulling into the top box.

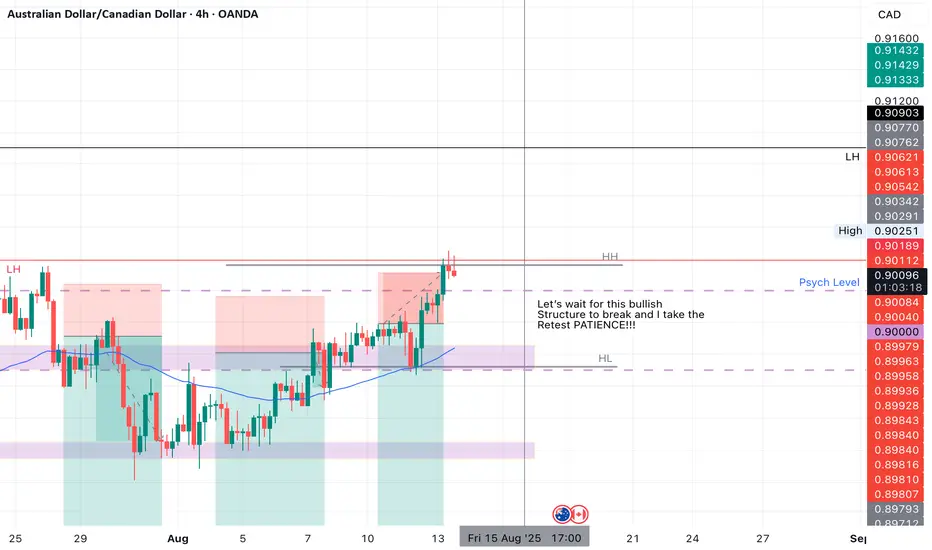
AUD/CAD H4 AnalysisSince bottoming out at the end of July and the beginning of August, we have seen buyers take price higher and an uptrend has now established.
Look for a buy setup that meets your rules if you agree with this analysis.

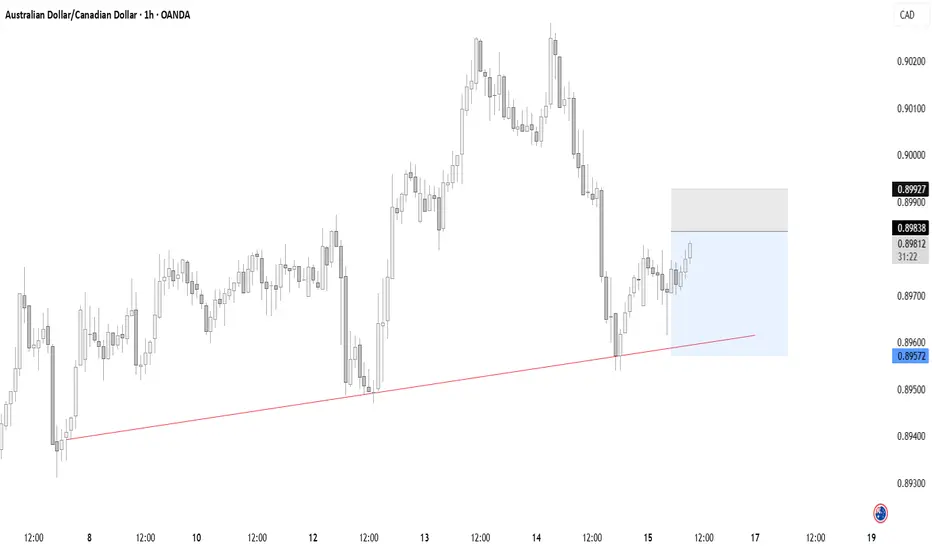
Bearish drop?AUD/CAD has rejected off the pivot, which acts as a swing high resistance and could drop to the 1st support, which is an overlap support that aligns with the 61.8% Fibonacci retracement.
Pivot: 0.8981
1st Support: 0.8928
1st Resistance: 0.9021
Risk Warning:
Trading Forex and CFDs carries a high level of risk to your capital and you should only trade with money you can afford to lose. Trading Forex and CFDs may not be suitable for all investors, so please ensure that you fully understand the risks involved and seek independent advice if necessary.
Disclaimer:
The above opinions given constitute general market commentary, and do not constitute the opinion or advice of IC Markets or any form of personal or investment advice.
Any opinions, news, research, analyses, prices, other information, or links to third-party sites contained on this website are provided on an "as-is" basis, are intended only to be informative, is not an advice nor a recommendation, nor research, or a record of our trading prices, or an offer of, or solicitation for a transaction in any financial instrument and thus should not be treated as such. The information provided does not involve any specific investment objectives, financial situation and needs of any specific person who may receive it. Please be aware, that past performance is not a reliable indicator of future performance and/or results. Past Performance or Forward-looking scenarios based upon the reasonable beliefs of the third-party provider are not a guarantee of future performance. Actual results may differ materially from those anticipated in forward-looking or past performance statements. IC Markets makes no representation or warranty and assumes no liability as to the accuracy or completeness of the information provided, nor any loss arising from any investment based on a recommendation, forecast or any information supplied by any third-party.

Sniper Entry on AUDCAD - SMC Concepts - Trade Code RevealedAlright snipers, here it is!
From today onwards, I will publish my live trades. My A+ setups.
In this one, I follow the H2 game ( Bullish) as there is no other game played at the moment on this pair contradicting my story.
Story says, H8 bullish, H2 bullish, BOS confirmed. Now market is mitigating towards an imbalance left behind and visible on m15/m8.
I am expecting this last point of true mitigation to be reached, inducing the last swing buyers who believe the market has to go up.
Also a very important info: market will break through the low of Asia and low of Europe sessions before taking off (0.89519)
No sign of reversal move either, H8 candles are closing above the H8 S/R. No sign of H2 or m30 reversal candlestick pattern (Rejection + Acceleration or Supply Zone). So we're good to go.
Enjoy this trade! See you on the one...

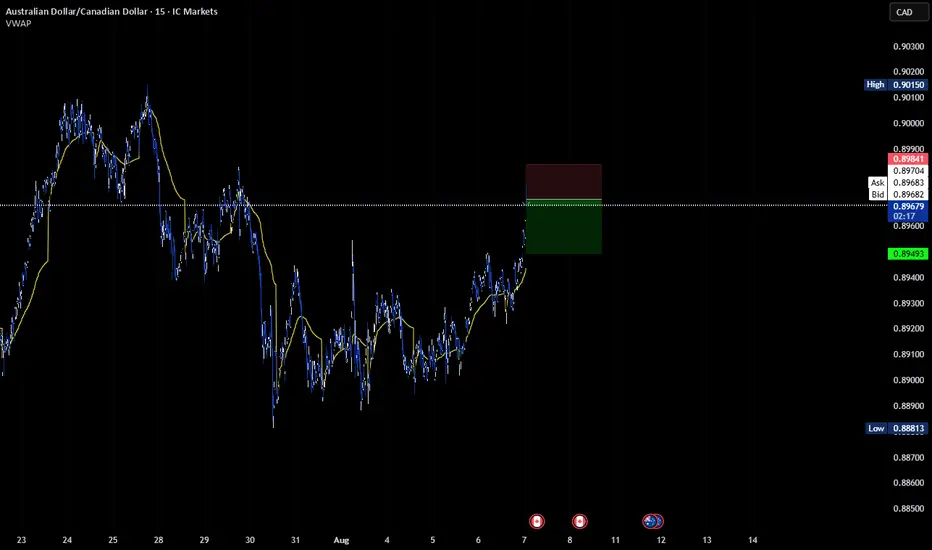
AUDCAD high probability short Like AUDUSD i called, we have been over extended on the oscillators for many candles, we have also pulled way from the VWAP for an extended distance and time period. we are going to put SL above most relevant high and shoot for VWAP as TP. I would layer multiple trades once per candle or twice per candle until we hit Sl or start the roll over into profit. Low risk per trade, max trade 7