BIG BEAUTIFUL BILL - Markets are Ready to PUMP Again! At the 4th of July, the Independence Day, the "One Big Beautiful Bill Act" was signed into law by President Trump. In this idea I want to take a closer look at some points of this law and explain why I consider it VERY bullish for most of financial markets, and especially for crypto.
Here are some key points of the law:
Raises the U.S. debt ceiling by $5 trillion, the largest single increase in U.S. history
Makes many Trump-era 2017 tax cuts permanent: keeps lower individual tax rates, preserves expanded standard deduction, retains corporate tax rate at 21%
Introduces new tax breaks: increases Child Tax Credit, exempts tips, overtime, and Social Security from federal income tax (with limitations)
Adds ~$150 billion to defense and another $150 billion toward border enforcement, including massive ICE budget increase
Trims SNAP food aid by ~$186–200 billion, tightening eligibility (e.g. raising work‑requirement age)
What changes can happen in the economy? Big tax breaks combined with increased expenses cause the growth of financial deficit, the projected by CBO deficit can reach $3 trillion. In this situation the only solution is increasing the national debt which makes Interest Rates climb higher (Yale’s Budget Lab forecasts a 1.2 pp increase in the 10‑year yield).
Why do I think this is bullish for most of stocks and mainly for crypto?
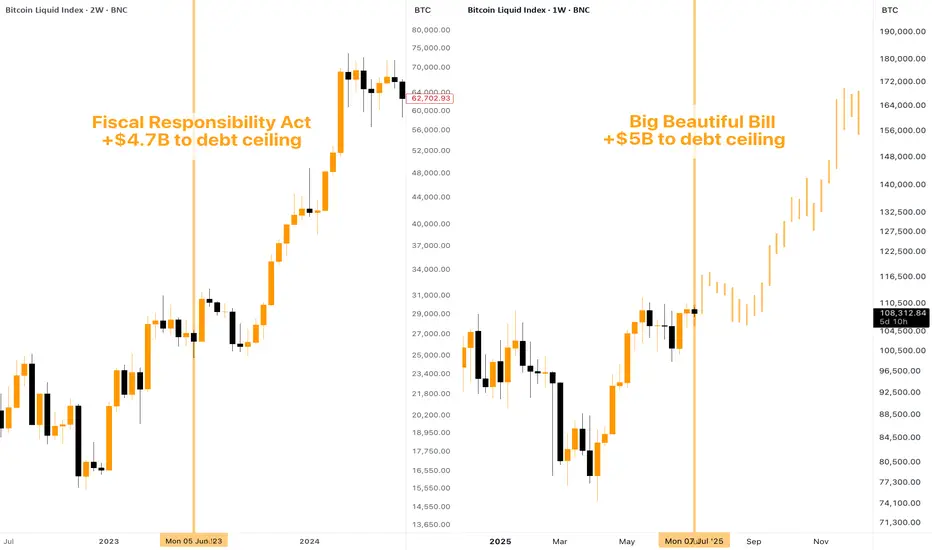
The increase of debt ceiling has always had a positive impact on the crypto and namely on $BTC. The best example is Fiscal Responsibility Act that was signed back in June 5, 2023. This act increased the debt ceiling for +$4.7 billion, after that Bitcoin surged upwards from $25,000 to $75,000 in ~half a year. Similar outcome can be expected now too.
Market perceives U.S. fiscal loosening as inflationary and dollar-weakening, making Bitcoin (as a decentralized and limited-supply asset) more attractive. TVC:DXY has already shown signs of weakness.
Large deficits often force future monetary easing or Fed bond buying to absorb debt. Lower interest rates and more liquidity are historically bullish for risk assets, including crypto.
Rising yields and bond sell-offs spook traditional markets. In this situation, Bitcoin becomes an attractive uncorrelated hedge for portfolios amid volatility in traditional assets.
To sum up , I believe the Big Beautiful Law is, to put it mildly, not good for US economy. However, local effects on stock & crypto markets can be considered positive for investors & traders. With this said, I believe we can expect CRYPTOCAP:BTC to reach $150,000 goal this year and mark this milestone as an ATH for the current bull cycle.
BLX trade ideas
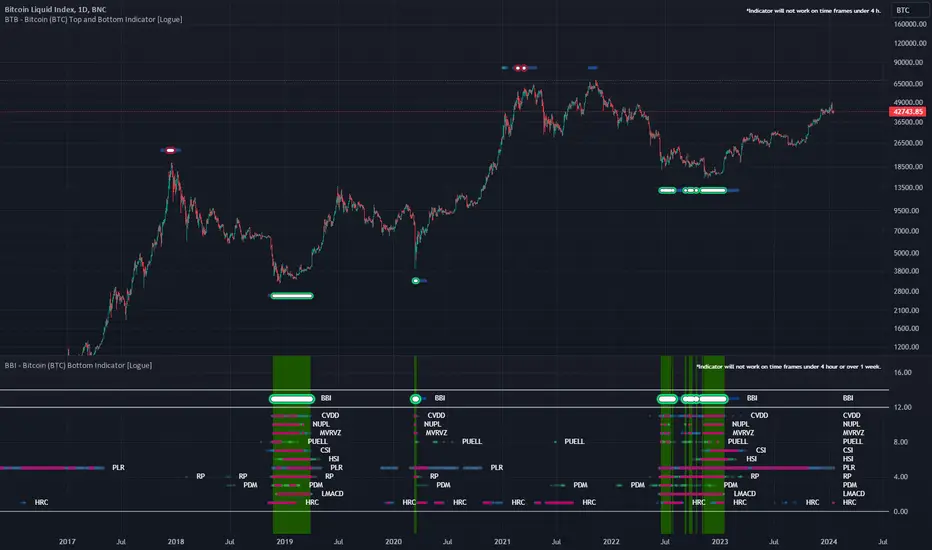
Hash rate capitulationThe hash rate capitulation (HRC) indicator used in the Bitcoin Bottom Indictor (BBI) has fired. The HRC indicator measures the rate of change of the hash rate. Steadily increasing hash rate is a sign of health of the bitcoin network. This indicator uses moving averages (20- and 100-day) of the hash rate to indicate when a decrease in the rate of change is has occurred (i.e., the 20-day MA goes below the 100-day MA). This indicator triggers when the 20-day moving average of the hash rate going below the 100-day moving average. In the past, this indicator has detected local and macro cycle bottoms. It does fire more often than most other bottom indicators, so take it with a grain of salt.
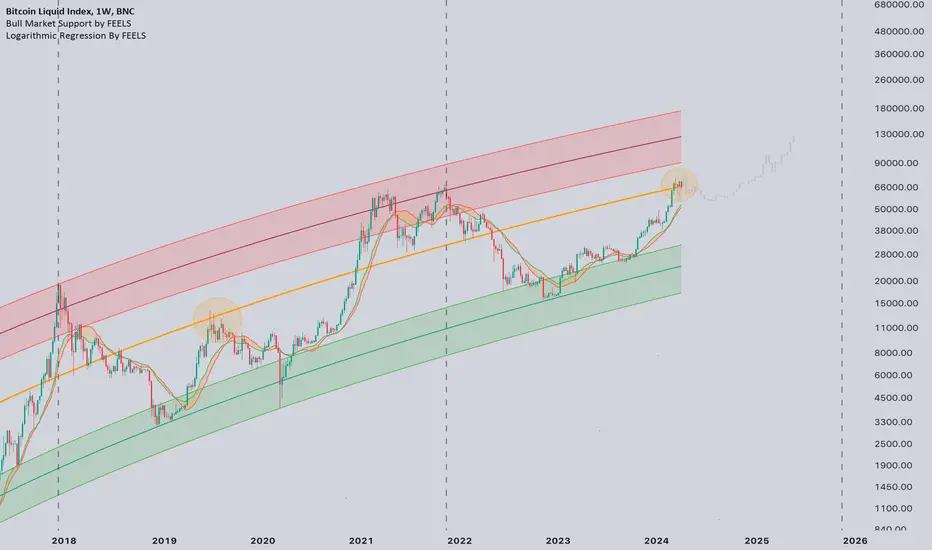
Bitcoin Log Regression 👀#Bitcoin Log Regression 👀
The orange line, as in the previous cycle, offers strong resistance.
💡I think CRYPTOCAP:BTC will stay at the current mark for another month. After that, we go to the correction, most likely it will not be a deep correction, but rather a consolidation.
This is indicated by overbought and seasonality.
⛏️ And also the capitulation of miners after the halving is possible, this will lead to a decrease in the hashrate, which will slow down the growth for some time. But do not be sad, the bull market will continue closer to autumn↗️
BTC reached the local peak? 👀#Bitcoin distance from BMS
Below is the oscillator, which shows how far the price has moved away from the bull market support. Mostly when we are in the 2-3 year of the cycle, the mark on the oscillator 40 acts as resistance, which indicates a mid-cycle peak.
Can it be different this time?🤔
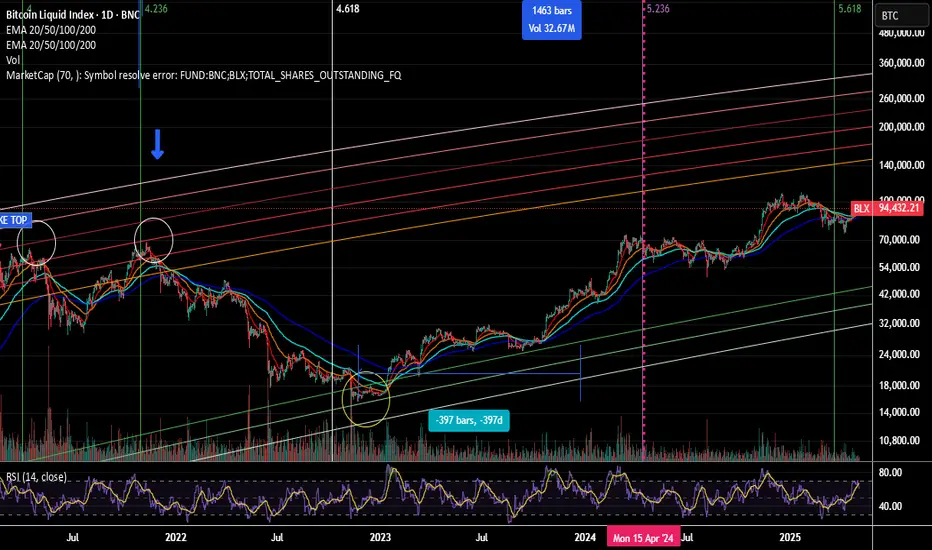
Let's imagine that the CRYPTOCAP:BTC ETF inflow will be greater and distort the situation, in this case, we have a second trend line that indicates a global peak, which, by the way, becomes lower every cycle, now this mark is around ~50 on the oscillator or 80k on the price chart. You can consider this mark a best-case scenario for a local peak.
💡Remember, a good investor does not rely on one scenario but is ready for any.

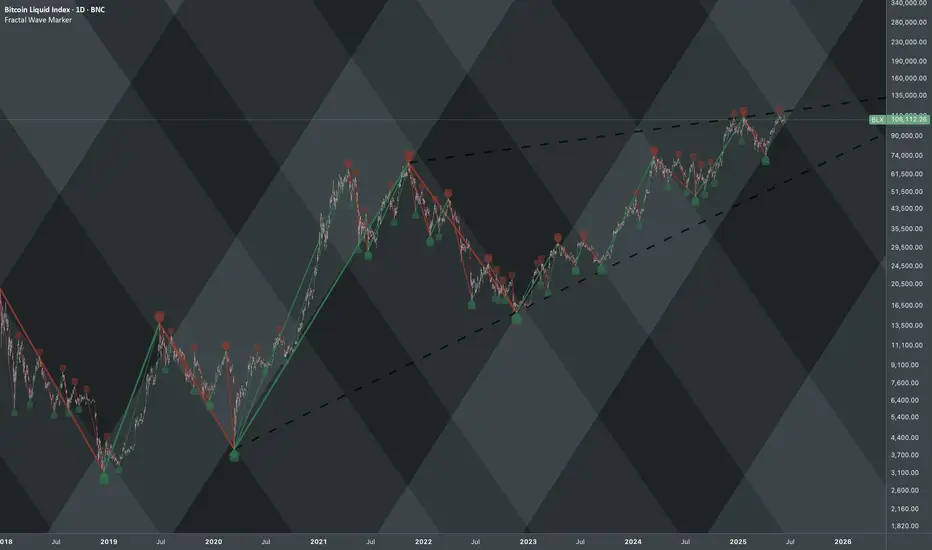
Bitcoin: Higher Degree Wave DimensionsA new long-term pattern has been identified. Essentially a stretched version of the chart shown here:
This resemblance holds to some extent, as the coordinates are anchored to relatively longer cycles:https://tradingview.sweetlogin.com/x/PUxSDlLx/
Publishing this one in raw form (intentionally minimal) just to document a recurring structure across extended timeframes.
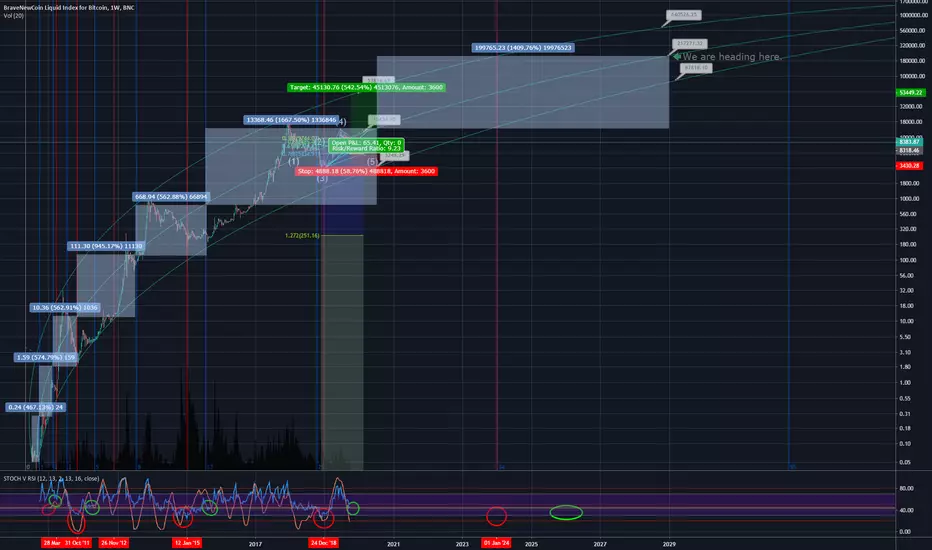
We are heading here12k is the average price of the market at the moment. we might 14x / 24x (depending on where you are starting) in the next ten years. BTC will be at around 200k $ at that time.

Bearish Logaritmic Regression AnalysisResume
This advanced logarithmic regression predicts we are about to reach top in the middle-late June. To start a bearish long term trend.
Discussion Analysis:
To extrapolate the current logarithmic regression trend. I tried to fit a sinusoidal wave to the logarithmic regression trend. The fitted Sin Wave is in dotted purple color when LogReg Trend is in green (bullish) phase right now. The logarithmic regression also is applied as deviation factors in Fibonacci channel terms (green and red transparent bands in the background).
Current status: we are already in a red (should sell) Fib. area which is a high risk scenario in the Log Reg. A higher risk region would be seen if the price pass to the last red section, where we would see the highest volatility for this cycle, before sudden, sharp declines.
I don't think we will reach the highest section of the Fibonacci Log. Reg. Channels. The only way we still could get there is if the fundamentals change dramatically: If FED drops the rates, if Trump stops the market wars, etc. Nobody knows. I think that may play out maybe at the end of the summer.
DISCLAIMER
This is not financial advice. I own several cryptocurrencies. This is only my mere opinion. Do your own research!
Good Luck.
Thor.

BITCOIN IS A SOLVED GAME. AND I SOLVED IT WITH 1 FIB PULLOne single fib pull to rule them all. From top to bottom in 2018 we can clearly see how many significant levels we get:
The 2.236 level gives us the first ATH in 2021. After that we face a 30% pullback.
The 3.618 level gives us the 63k top in 2021, again to the absolute dollar.
The 4.236 level gives us the first ATH of 2024, after which we faced 230+ days of sideway nothingness.
The 6.236 level gives us the exact ATH at the end of 2024
Following the logic of these numbers the next levels we should look for are: 7.618 and 8.236

Inverse DXY 3-months forward suggests Bitcoin top early JulyInverse 3-months forward DXY (blue) seems to guide Bitcoin, and if the current DXY low holds, Bitcoin might top in early July. This idea is corroborated by The 2024-2028 Bitcoin cycle in grey, which bottomed and topped out within a similar timespan. It is also confirmed by Lars von Thienen's observation, that Bitcoin has 5 200D cycles each bull run www.youtube.com

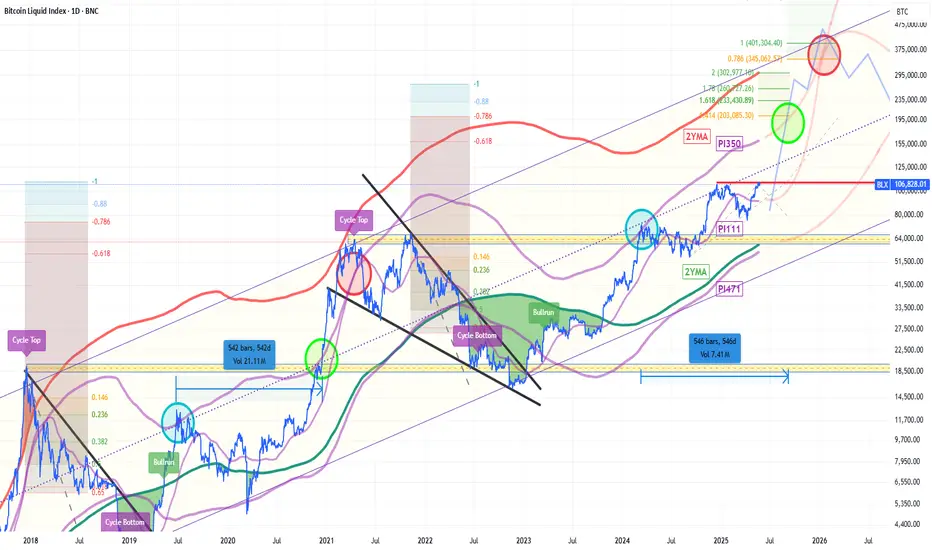
Halftime For Bitcoin [BTC] [PiCycle] [2YMA]Let us be curious whether the Pi-Cycle-Top-Indicator and the 2YMA hit again this time. Maybe "this time is different". But most likely - as always - not.
I watch BTC to cross PI350. And you?
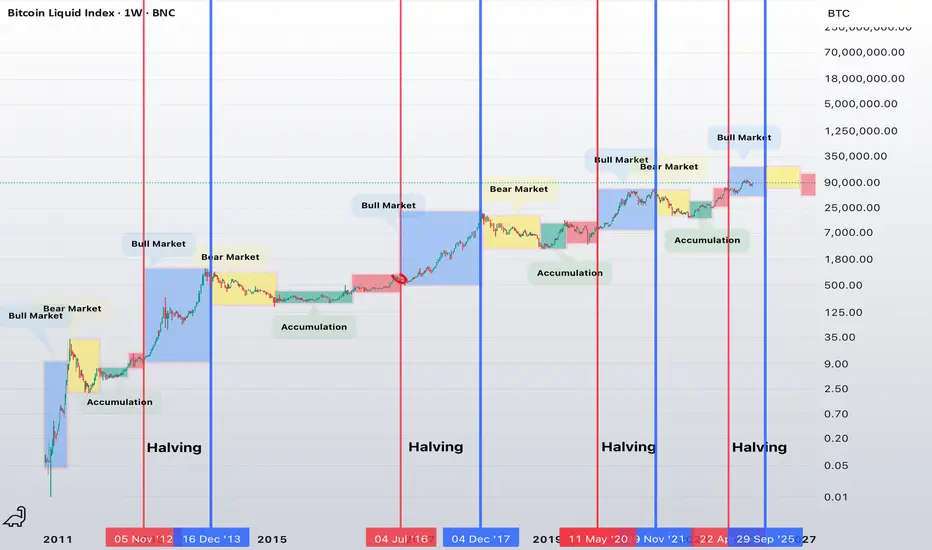
Bitcoin Halving CyclesBitcoin halving cycles chart with signficant bear market lows and highs marked. Bull, bear and consolidation phases noted in red, green and orange.

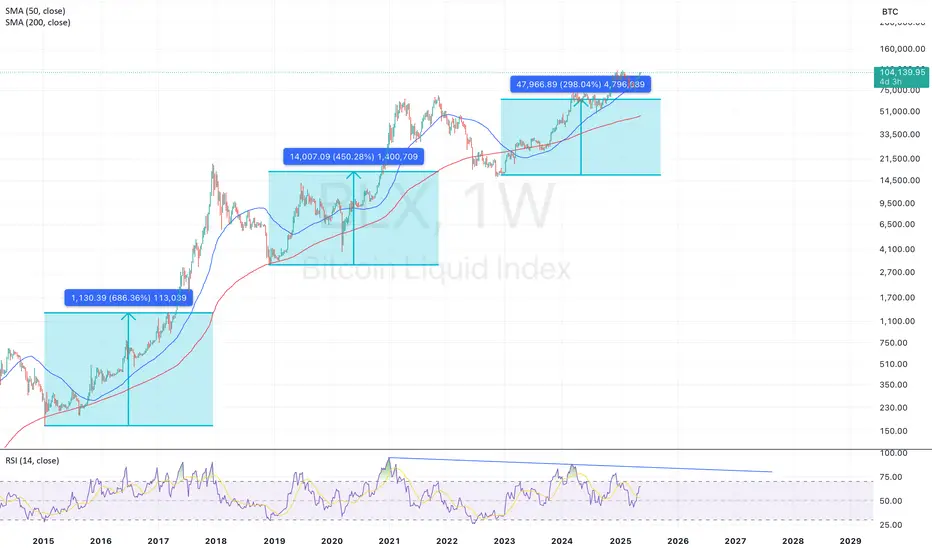
Predicting the Next Bitcoin 200MA Peak Using Exponential DecayIn my ongoing study of Bitcoin market cycles, I noticed a compelling pattern in the behavior of the 200-day moving average (200MA) across bull markets. Specifically, I observed that the percentage rise of the 200MA from each cycle bottom to cycle top is decreasing over time, and this decline follows an exponential decay pattern.
Historical Observations:
• 2015 Cycle Bottom to 2017 Peak:
The 200MA increased by approximately +686%
• 2018 Cycle Bottom to 2021 Peak:
The 200MA increased by approximately +450%
This pattern suggested to me that the next peak in the 200MA might continue this decaying trajectory. To estimate this, I applied a simple exponential decay model using the two previous data points:
y(t) = A.e^{-kt}
Solving for the next value (t = 2), the model predicts an approximate increase of +296% in the 200MA from the current cycle bottom to the expected peak.
Implication for the Current Cycle:
Assuming the 200MA bottomed around $16,200, a +296% rise implies a target 200MA near:
$16,200 x (1 + 2.96) is approx. $64,000
This aligns remarkably well with the 2021 bull market top, reinforcing the idea that the previous all-time high (~ GETTEX:64K –$69K) could serve as a strong macro support level once this cycle matures.
Conclusion:
If this exponential decay pattern continues, we can expect the 200MA to peak around $64,000 during the current bull cycle. This target also coincides with historical resistance turned potential support, making it a critical level for long-term investors and swing traders alike.
This type of decay-based modeling, while not exact, offers a unique lens through which we can assess Bitcoin’s macro behavior across cycles. I’ll continue to monitor how this projection plays out and refine the model with new data as the market evolves.

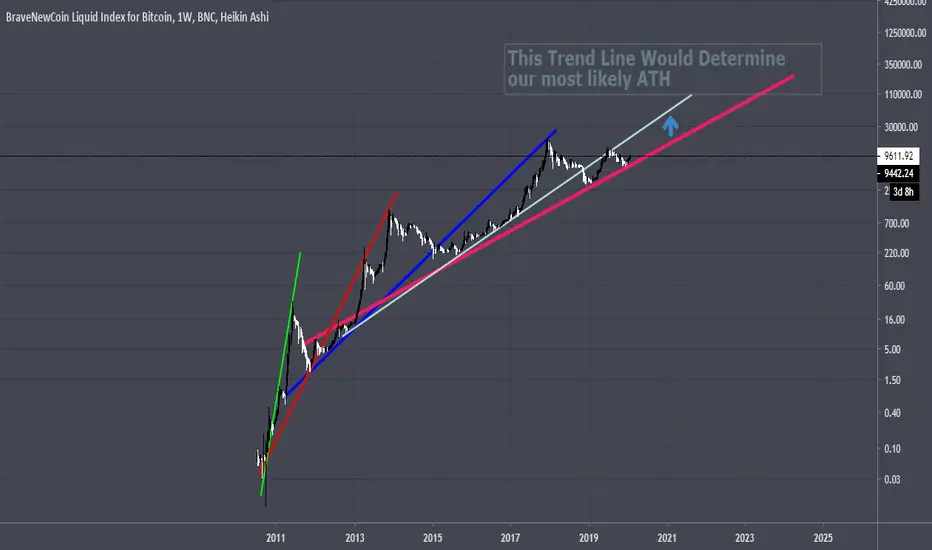
Where Would Be OUR NEW ATH!A chart simply well put and long thought
It is simple and self explanatory. Fill your bags
Bear market cycle measures - BTCTurning the chart upside down helps a lot! Used exponential decay to calculate the next data point in the returns section after the midpoint in the bear market (trough to trough)
BTC - Diminishing Returns; Risk BandsNo conclusive forecasting, rather documentation of price and time trends; ATH price contraction within the bands acting as resistance, and critical extrema (lows & highs) coinciding with Fibonacci time levels.
BLX monthly trend channelThe BLX trend channel has been corrected; the previous trend channel was probably incorrect. This is what it should look like. The mid band is important since it has marked significant resistance and support in the past. It gives us a price target of around 400k.

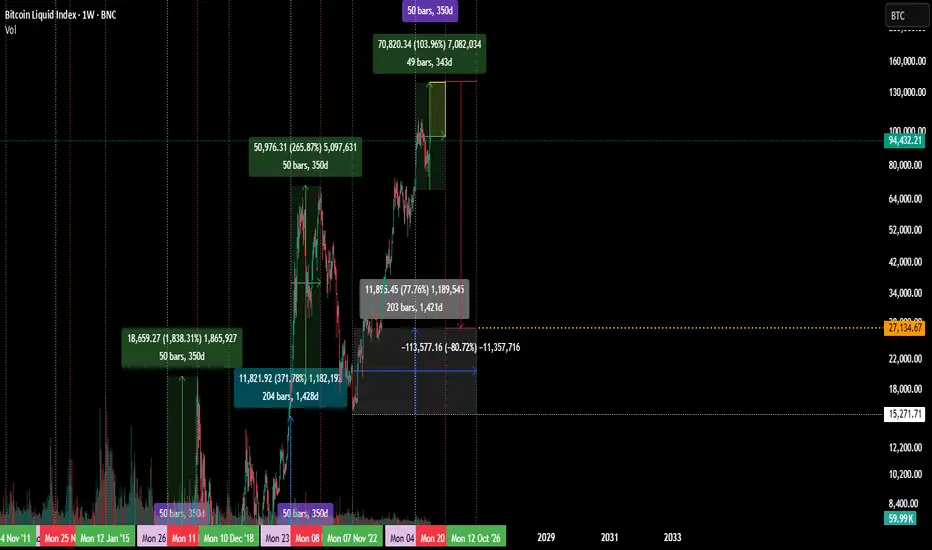
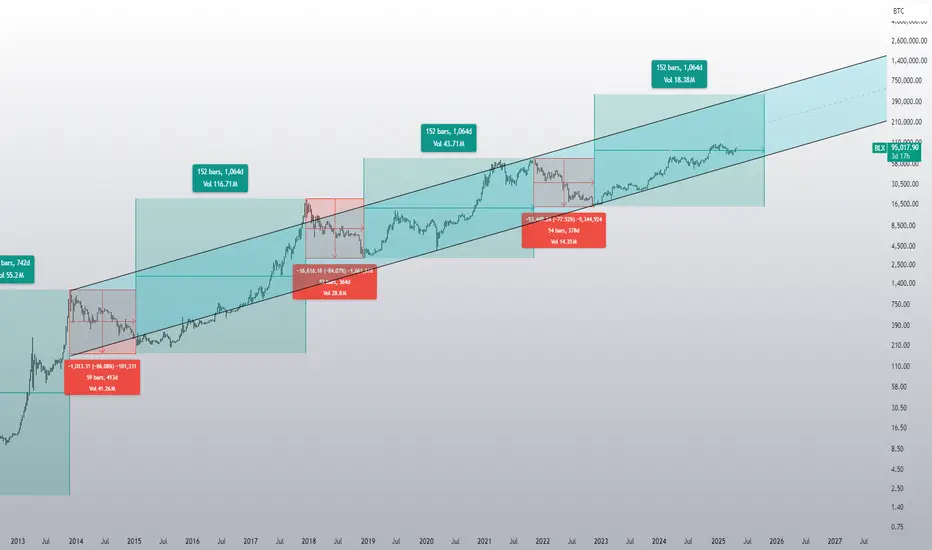
Bitcoin price according to the Bitcoin Liquidity IndexThe Bitcoin bull market from its low in January 2015 to its high in December 2017 lasted 1064 days and the price rose from $163.88 to $19,764.51.
The Bitcoin bull market from its low in December 2018 to its high in November 2021 took 1064 days and the price rose from $3,211.19 to $68,944.62.
If this is repeated, the Bitcoin bull market from its low of $15,804.43 in November 2022 will find its high of $500,000 or more in October 2025, which Bitcoin could easily do if you look at 2017, for example.
BTCUSD vs. M2 Supply - It's HOT Right Now!🔥 BTCUSD vs. M2 Supply 💸📈 – It’s HOT Right Now! 🔥
Everybody has been posting M2/btc charts. Here's mine:
I roughly averaged the trends for PRE and POST-lockdowns MARCH 2020 for both global M2 and bitcoin. Bitcoin is on a log trend so that it can keep up with how absurd the money printing is. Even so, M2 is currently out-pacing bitcoin's trend, so something has to break.
M2 is charted against 3 months lag.
This graph is highly experimental and for reference only.

Once we break and hold above $100K, it’s ALTCOIN SEASON🔥🔥 THE HEAT IS ON 🔥🔥
Hey fam! 😎✌️
The market is warming up for summer 2025, and the whales are scooping up BTC like crazy! 🐳
+2 BILLION $$ in Bitcoin Spot ETF inflows in just the last 2 days! 😱
We’ve just seen the largest BTC exchange outflow since Feb 2023, a strong sign of massive accumulation ahead of a potential rally 🚀🚀🚀
We’ve hit our $93K target, as predicted earlier — now I’m looking for a pullback to GETTEX:87K - $85K.
💡 That’s where you’ll find the tastiest altcoin entries.
Once we break and hold above $100K, it’s ALTCOIN SEASON
The Perfect Bounce- Quick update
- IYKYK.
- Everything is in graph, no need a long speech.
Happy Tr4Ding !

The Road to The Mooni like to make some graphs like that when peoples are in Dispair mode.
- i used a modified ADX indicator with a Monthly Timeframe ( thanks to the creator by the way )
- Look at the Mountains and tell me when in past bullruns we stopped at 100 ? - Never -
- The Highest Point is 160+
That said my advice for now is : " You don't really care if TheKing will back to 20k, what you have to care is the Highest point TheKing will reach! "
- Don't Think it's the end of this bullrun
- Don't Listen Fuders
- Use indicators for the Long Term
- Believe in Trends and cycles movements
- Believe in the future of cryptos
- Believe in TheKing because Theking cannot die.
Happy Tr4Ding !
