LONG ES after London Open*I like the long better for london open.
From 6000, weak liquidity built up above, Finished business below, macro SMAs buy bias...
HOWEVER there is also a good case for shorts as we are heading up into futures open, SMAs and there is LVN space below to squeeze into. So... I will be looking for finis
Related futures

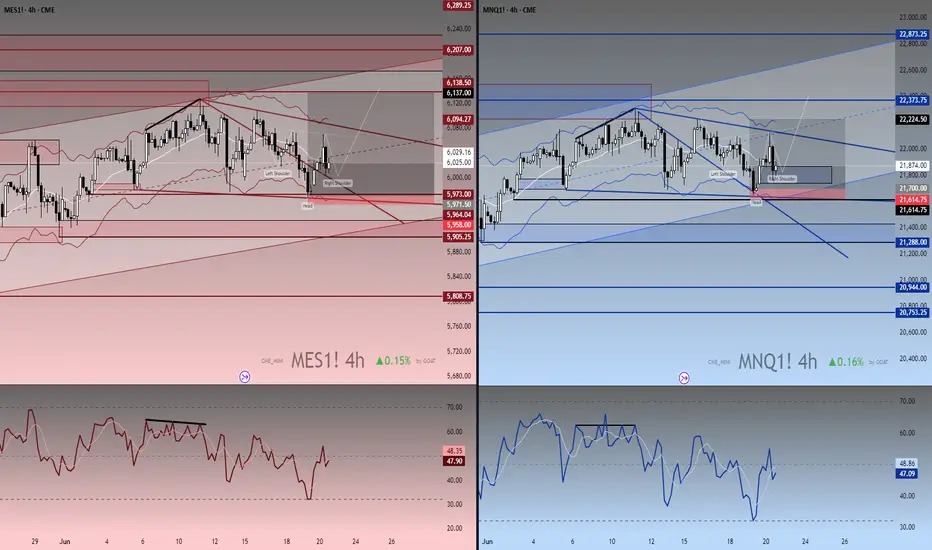
Watch These Reversals – MES & MNQ at Major 4H Turning Points!Chart Breakdown: MES1! & MNQ1! – 4H Timeframe Analysis by GOAT
This dual-pane chart presents a detailed technical analysis of the E-mini S&P 500 Futures (MES1!) and Micro Nasdaq Futures (MNQ1!) on the 4-hour timeframe, designed with a custom visual aesthetic and proprietary tools by GOAT.
🔺 Left Pa
ES1! Futures
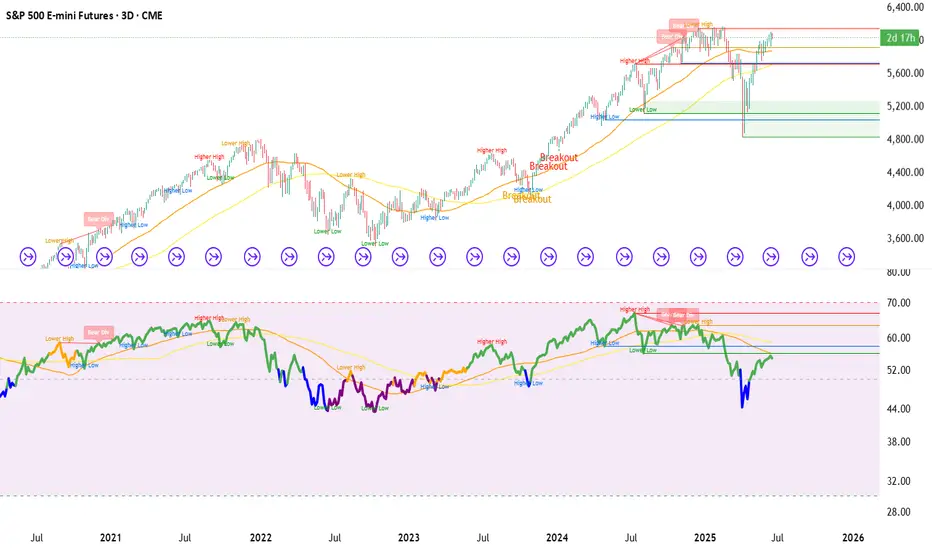
Looking at the 3D ES futures. Does it look bullish? Will it make ATH? Just look at that RSI!
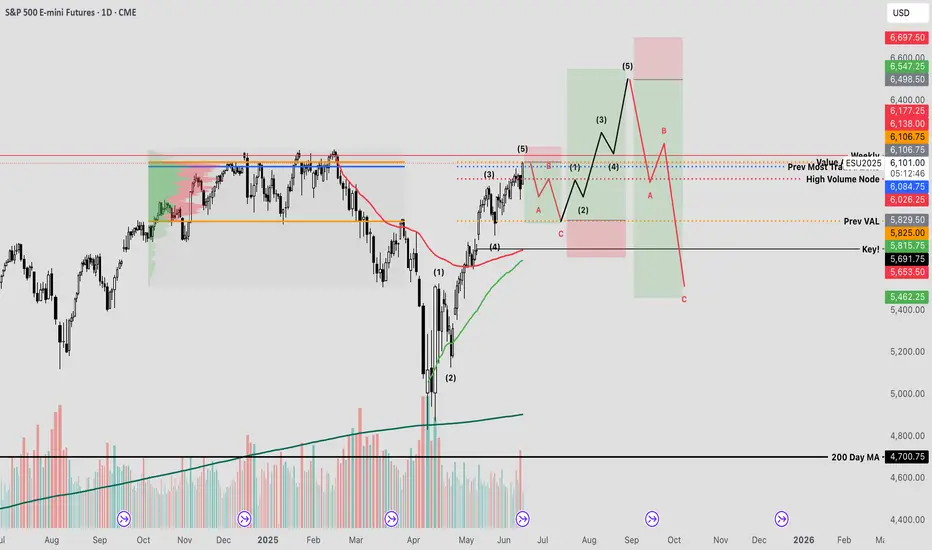
ES1!/SP500 Targeting Weekly Range Resistance***QUOTING SEP CONTRACT FOR JUNE CONTRACT OR CASH US500 EQUIVALENT LEVELS SUBTRACT ~52 POINTS***
***WEEKLY ACTION AREA VIDEO TO FOLLOW AHEAD OF NY OPEN***
WEEKLY BULL BEAR ZONE 6090/6100
WEEKLY RANGE RES 6150 SUP 5914
DAILY RANGE RES 6090 SUP 5972
DAILY VWAP BULLISH 6019
WEEKLY VWAP BULLISH 59
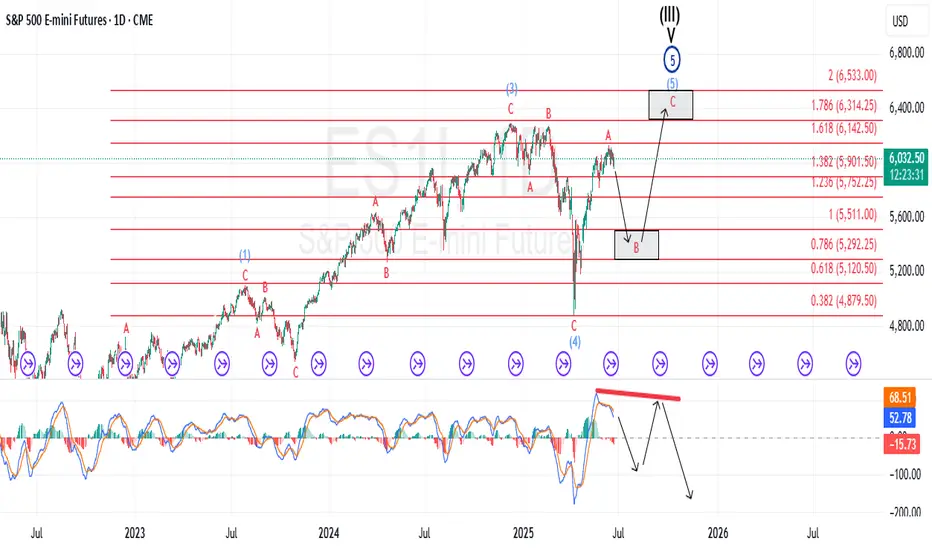
A Trend on Borrowed Time, A Micro ED within a Larger ED?Since mid-last month, the broader equity market has been grinding higher — but not with confidence.
The advance has been marked by choppy, overlapping price action that feels more hesitant than bullish. Yes, prices continue carving out higher highs and higher lows, but MACD momentum tells a differ
We may see lower prices for S&P FuturesHi Trading Community,
Over the past few weeks, I've been emphasizing the bullish nature of the market. However, in today’s video, I’m urging caution on long positions. Given current geopolitical trends and the recent candlestick formations, there’s a possibility we could see lower prices on the ES.

Sellers maintaining controlSellers maintain control in their shortened S&P 500 daily session. Further movement to the downside would be expected however we are approaching levels the buyers have entered this market previously. So be careful on the short side of this market.

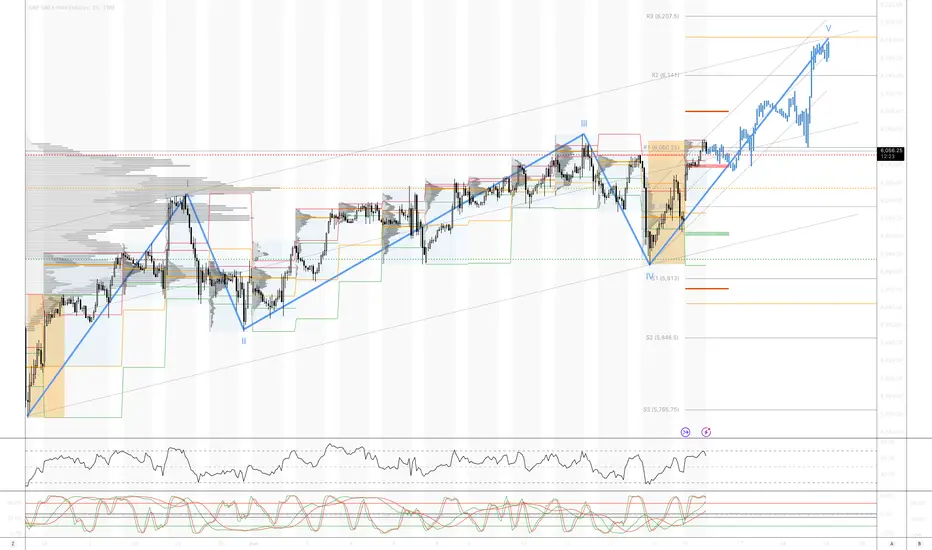
SPY 5 Wave Impulse The broader equity market has staged a significant rebound from the panic-induced tariff lows seen in April, reclaiming the previously established value area with notable strength. Generally, when price reclaims a value range, it can be common for price to oscillate within the value area high, and l
Buy OIL & GOLD, Sell Stocks Indices When Missiles Are Flying!In this Weekly Market Forecast, we will analyze the S&P 500, NASDAQ, DOW JONES, Gold and Silver futures, for the week of June 16-20th.
When missiles start flying in the Middle East, investors become reactively risk averse. Money goes from stocks to safe havens and oil. That's it. Expect oil pric

S&P 500 E-mini Futures In the S&P 500 futures (/ES), a decisive break and close below 5965 would confirm bearish structure on the higher time frames, signaling a shift in market sentiment. Following the break, we anticipate a corrective pullback toward the 6000–6010 supply zone. This retracement can offer an optimal short

See all ideas
A representation of what an asset is worth today and what the market thinks it will be worth in the future.
Displays a symbol's price movements over previous years to identify recurring trends.
Frequently Asked Questions
The current price of S&P 500 Index Futures is 6,232.75 USD — it has risen 1.02% in the past 24 hours. Watch S&P 500 Index Futures price in more detail on the chart.
Track more important stats on the S&P 500 Index Futures chart.
The nearest expiration date for S&P 500 Index Futures is Jun 18, 2026.
Traders prefer to sell futures contracts when they've already made money on the investment, but still have plenty of time left before the expiration date. Thus, many consider it a good option to sell S&P 500 Index Futures before Jun 18, 2026.