AMP Futures | OCO Bracket orders with Chart Trading.In this idea we will demonstrate how to apply an OCO bracket order on the Chart trader using TradingView.
WSPH2026 trade ideas

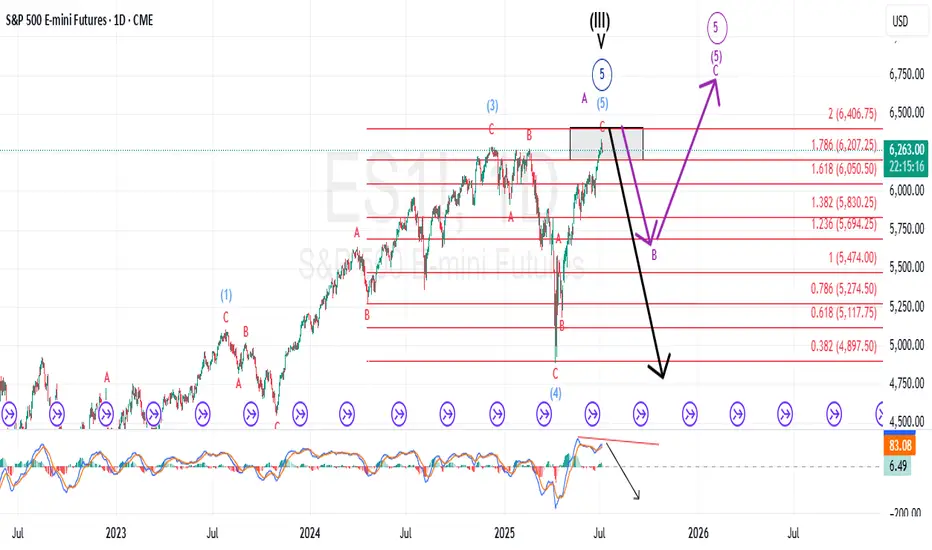
Are We Completing the Larger Ending Diagonal Now?The last time I updated followers of my work; I stated that the pattern was advancing, but NOT with confidence, and that it is marked with choppy, overlapping price action that appears to be an ending diagonal. Those sentiments have not changed.
However, what has changed is I was forecasting a more pronounced drop first before getting to new highs. It is now possible; this move higher is completing that move on a more immediate basis. Although I cannot rule out the previous larger ABC... it is more likely once this high completes, it could represent the end of the bull market.
Only the structure of the decline will inform us what is playing out.
I will warn followers that once this more immediate high completes, I am expecting a forceful and swift reversal that will undoubtedly catch most traders off guard.
Best to all,
Chris
How to Spot Flag Patterns on TradingViewLearn to identify and trade flag patterns in TradingView with this step-by-step tutorial from Optimus Futures. Flag patterns are continuation formations that help traders join existing trends by buying high and selling higher, or selling low and buying back lower.
What You'll Learn:
• How to identify bullish and bearish flag patterns on any timeframe
• Breaking down flag patterns into two parts: the flagpole and the flag
• Finding strong flagpole formations with fast, obvious price moves
• Spotting flag consolidation areas that form tight ranges
• Why flag patterns work: buyer and seller psychology explained
• Real chart examples showing how flag patterns develop and play out
This tutorial may help futures traders and technical analysts who want to trade with market trends rather than against them. The concepts covered could assist you in identifying opportunities to join strong price movements when they pause before continuing.
Learn more about futures trading with Tradingview: optimusfutures.com
Disclaimer:
There is a substantial risk of loss in futures trading. Past performance is not indicative of future results. Please trade only with risk capital. We are not responsible for any third-party links, comments, or content shared on TradingView. Any opinions, links, or messages posted by users on TradingView do not represent our views or recommendations. Please exercise your own judgment and due diligence when engaging with any external content or user commentary.
This video represents the opinion of Optimus Futures and is intended for educational purposes only. Chart interpretations are presented solely to illustrate objective technical concepts and should not be viewed as predictive of future market behavior. In our opinion, charts are analytical tools—not forecasting instruments. Market conditions are constantly evolving, and all trading decisions should be made independently, with careful consideration of individual risk tolerance and financial objectives.

AMP Futures - How to export data from your Trading PanelIn this idea, we will demonstrate how to export data from your Trading Panel using the TradingView platform.
Unfortunately, the recording did not show the demonstration of the exported CSV files; however, as long as you follow the steps provided, you will be able to export the proper data.

14 day look ahead at ES spy futures
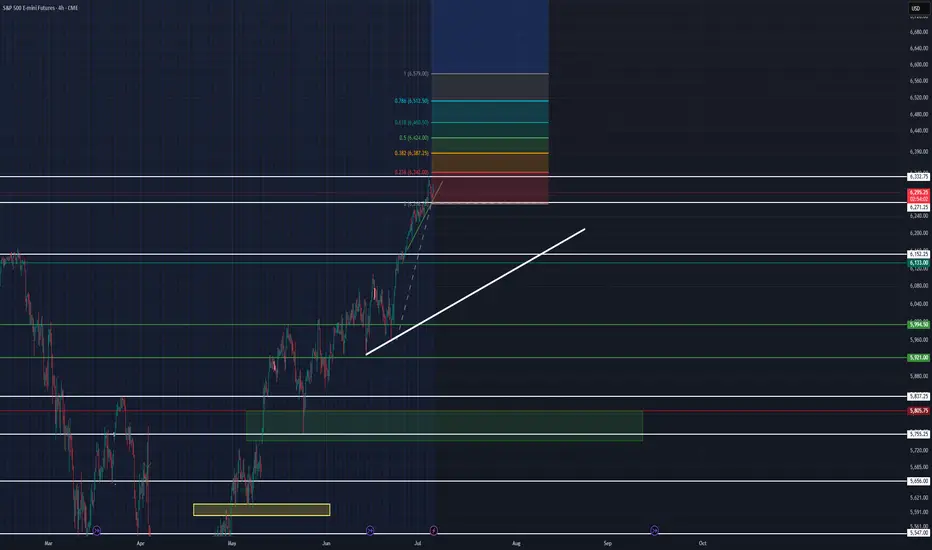
CME_MINI:ES1! I am watching fundamentals and any incoming tariff news this week (mostly for scalps on small timeframes). This is because of the Japan news reaction we saw last week which presented good opportunity.
Bear: I am watching price seek possible consolidation up here after being bullish at a strong upwards angle. I see small exhaustion being cooled off and possibly looking for more cooling until the middle of this week, I expect no serious price movement until Wednesday July 9, 2025. Watching that 4h green slanted trendline to break for scalping opportunities. If the white larger trendline is broken I will be considerably more bearish that we would likely reach a price of 5,805 or lower again, this would be a lot to ask but it is a location I would assume price would find solid support if reaching that area in the future weeks/ month. Watching horizontal lines for support this week specifically at price 6,271 to be broken or held. There looks like there is some slim price action (little support or resistance) from 6,100 to where we are now. This could push the downward volume quicker to the downside possibly presenting great opportunity for bears in the possible near future, if we break down below 6,197.
Bull: we are clearly in a macro bullish trend it is silly to decide we would all of a sudden drop significantly unless something obscene happens fundamentally. I step into this week assuming we will keep strong upward trendlines far above the macro (my white thick) trendline. watching fib extension levels for more upside since we are consolidating a bit already it would be easy to assume we will jump up to the .236 at 6,342 and even get to the .382 at 6,387 and higher. I still expect the ADX to cool down here in the beginning of the week if not all week. I also assume to see the rsi finish its bearish divergence off with a strong predicted sell off- but to reach higher highs after (buy the dip, trade the reaction, WAIT for the dip).
DIYWallSt Trade Journal: Missed Entry & Climbing Back From Loss **07/11/25 Trade Journal, and ES_F Stock Market analysis **
EOD accountability report: -46.25
Sleep: 5 hours
Overall health: Good
** VX Algo System Signals from (9:30am to 2pm) 3/3 success**
— 9:41 AM Market Structure flipped bearish on VX Algo X3!
— 10:15 AM VXAlgo ES X7 Buy signal,
— 10:23 AM Structure flipped bullish
— 11:30 AM VXAlgo ES X3DD Sell Signal
**What’s are some news or takeaway from today? and What major news or event impacted the market today? **
I was a little busy this morning and missed the chance to short the market at MOB with Bearish market structure at 9:30, so I had to wait for the next chance but when i shorted the MOB on the move up, the X7 buy signal came out and pushed market structure bullish.
Ultimately If i had a better entry on my short, I would have been okay, but since i shorted early, i got stopped at at 6306 and it ended up dropping right after that. So the day actually started pretty bad and i was -300 from there and was just trying to climb back and forth the next few hours.
News
*LATEST TARIFF THREATS COULD DELAY RATE CUTS, CHICAGO FED’S GOOLSBEE SAYS - WSJ
**What are the critical support levels to watch?**
--> Above 6290= Bullish, Under 6280= Bearish
Video Recaps -->https://tradingview.sweetlogin.com/u/WallSt007/#published-charts


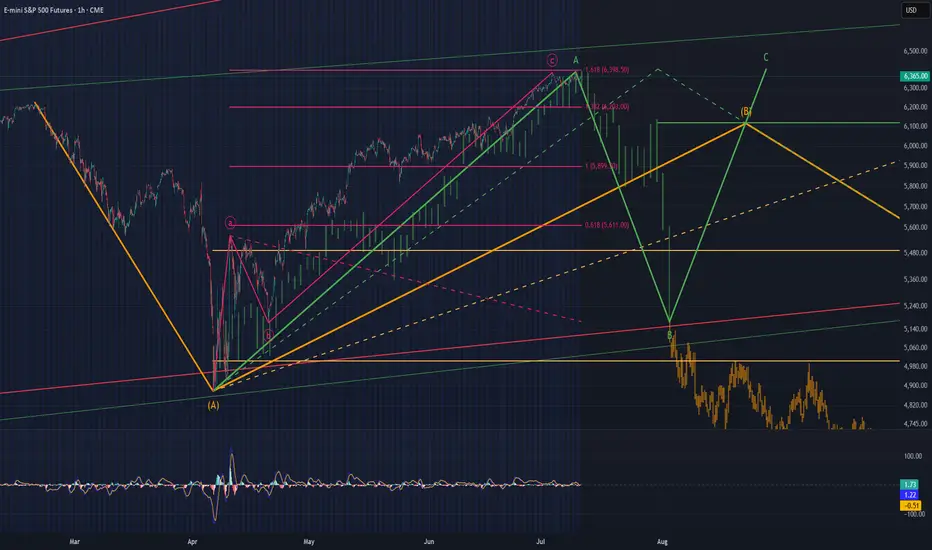
TACO about to become TUFTThe acronym "TACO" has been adopted as a market slogan to explain the shocking volatility brought on by Trump's follow through with his campaign promises to enact and/or adjust tariff's in the USA on its trading partners around the world. The mere mention resulted in a 1,334 point sell-of culminating in April. When Trump walked back {read: backed off in terms of immediacy of effect..} the market "rallied."
However, at the bottom of the lows, ES1=4,832, all strength fell out of the index and all Minor pattern lows were breached. This leads me to believe that 4,832 was just that...a LOW and not a bottom. To resolve this aspect of the price pattern in relation to strength, price and go for a higher low on less strength, or a lower low on more strength...either way, this can only result in a sell-off of .618 of 1,334, or approximately 824 points. Assuming participants intend to go lower on more strength, the bottom will be struck approximately 2,159 points lower in the 4,200 region, since this irregular B has complicated the direct 1.0 hit in the 4900 region. Still possible, but unlikely we swing within 100 points of the low, all while strength falls out and holders get brave.
The other problem I see with this wave higher is that it is sloppy. How?
(1) It is sloppy first of all because as it approached its 1.382 level off the first wave up (at least as noted by a premier Elliot Wave pub) it basically ripped right through. What is healthy for an impulse is to approach the 1.382, then pause for a retracement to the 1.0.
(2) The wave began with an obvious 3 wave pattern, and I was surprised to see prominent publications accepting such an obvious corrective pattern as the start of a true impulse upward. The 3 waves that took us to 5,528.75 are accordingly labeled as the A wave on this chart. Even if this is an Ending Diagonal, which is a motive wave, but not an impulse, which starts with 3 waves, we should at minimum get overlap at the 5,528.75 level in order to continue higher.
(3) We are getting mixed MACD readings between the daily and hourly charts right where price would be expected to blast off if the daily is correct and would be expected to fail if the hourly bearish divergence is correct.
As we approach this 1.618 level of 3,398.75 on ES2, off the pattern as stated, we can use it to guage the downside expectation. A direct hit and sell-off might lead us to the conclusion that the 4900s are in order or even 5400s, but a failure here, 10-20 points off, would be considered more bearish. Giving the benefit of the doubt to price, I have included various ways that price can regain its footing, here stating a primary count that this is the Minor A of an intermediate (B) wave, because it has been very bullish, very disorganized, and has created a higher MACD reading on the daily chart. Alt count is that this is All of Intermediate (B), and Intermediate C should commence to carry price into the low 4k region.
If price is to go higher, it must overcome a 3 wave start, an irregular and disorganized pattern, and conflicting strength readings...not to mention, a Fundamental hurdle that Trump Ultimately Follows Through.
DXY, EURUSD, ES1! Daily Trade SetupsIn this update we review the recent price action in the Dollar Index, EURUSD & E-mini SP500 and identify the next high-probability trading opportunities and price objectives to target. To review today's video analysis, click here!

Accumulation to Acceleration ESThis chart shows a long-term market analysis using Elliott Wave Theory, suggesting the market is currently in Wave 4 and preparing for a big Wave 5 rally.
📈 Past yearly moves averaged 15–21%, with 30%+ currently and up to 66% historically.
🟩 A "rebalance" zone (accumulation phase) is forming before a possible breakout.
📊 The next move projects a +60% rally, targeting 7,112 to 7,570.
🔁 Historical patterns and past rallies are being used to support this bullish forecast.
Bottom line: If history repeats, a strong upward move is expected soon.

Watch me trade NQ LIVE!This is a just a quick video showing what I look for in order to take a trade.
I entered a short on NQ minutes ago, looking for 2.44 RR!
Apologies for this rough cut video. It was spur of the moment, and I wanted to share with my followers and viewers!
Enjoy!
May profits be upon you.
Leave any questions or comments in the comment section.
I appreciate any feedback from my viewers!
Like and/or subscribe if you want more accurate analysis.
Thank you so much!
Disclaimer:
I do not provide personal investment advice and I am not a qualified licensed investment advisor.
All information found here, including any ideas, opinions, views, predictions, forecasts, commentaries, suggestions, expressed or implied herein, are for informational, entertainment or educational purposes only and should not be construed as personal investment advice. While the information provided is believed to be accurate, it may include errors or inaccuracies.
I will not and cannot be held liable for any actions you take as a result of anything you read here.
Conduct your own due diligence, or consult a licensed financial advisor or broker before making any and all investment decisions. Any investments, trades, speculations, or decisions made on the basis of any information found on this channel, expressed or implied herein, are committed at your own risk, financial or otherwise.

SPX Is Pure RiskAbsolutely insane for people to be saying things like "a new bull market" when it never ended. All of the risk is to the downside. If markets ran another 10% to the upside that gives investors a chance to determine if they want to buy a correction to see new highs or not. But to say that a bull market is coming is the antithesis of thinking when current risk is all downside.
This is risk management 101:
Lets say you have a SP:SPX target of 10,000, would you rather buy it at 6,500 where you know your downside is 7-8% or right here at 6300 with a potential downside of 22%+?
Who in the market is long right now? Everyone because all the short sellers are stopped out, and the dumbest of money the guys who just got promoted to the rank of captain in the branch of hindsight bought the "breakout."
The retracement to the highs has been one of the most hated rallies off of a bounce ever seen and why? Because it required a large amount of vibes and to a degree stupidity to buy where it bounced but it paid off. So if it was borderline stupid to do that, what does it mean to lever up at the top?
The correct method is to either be short here or be patient for a breakout with volume and a successful retest. There you can limit your downside and have nearly unlimited upside if it plays out that way.
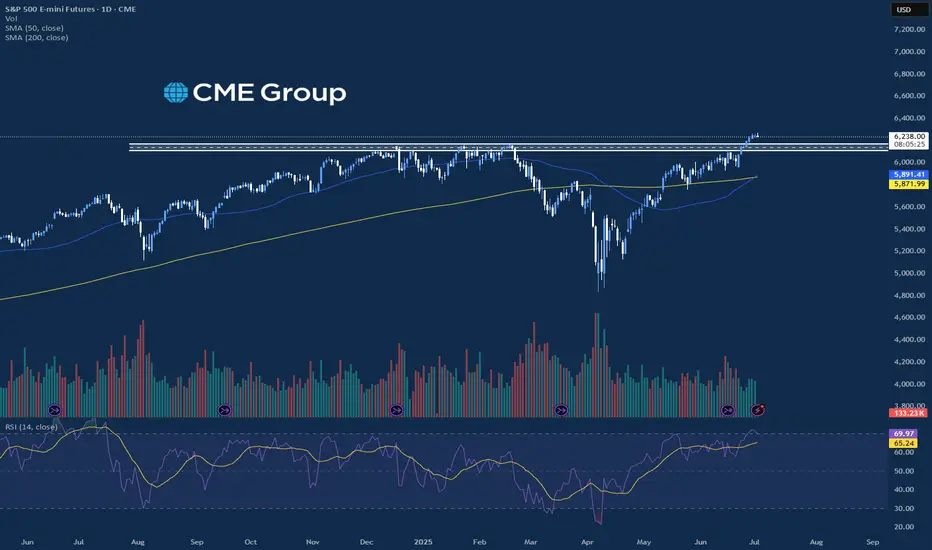
Stock Index: ES, NQ, YM Weekly Update📈 S&P 500, Nasdaq & Dow Jones – All-Time Highs, But Caution Creeping In
🟩 S&P 500 | Nasdaq | Dow Jones
All three indices hit new all-time highs to close out June.
Powered by:
🔋 AI optimism
💰 Solid earnings
🕊️ Dovish Fed tone and falling bond yields
SPX continued its breakout run
Nasdaq surged as big tech led the charge
Dow followed with slower but steady strength
⚠️ But Watch the Signs Beneath the Surface
Consumer confidence dropped sharply
Home sales weakened
Fed speakers remained non-committal on cuts
All three indices now look extended — particularly Nasdaq
Momentum remains bullish, but these rallies are now resting on softening macro, yield compression, and hope that the Fed stays on hold.
🧠 Key Takeaway
Price action is euphoric — but fundamentals are flashing mixed signals.
When tech leads the market at extremes, volatility risk is elevated.

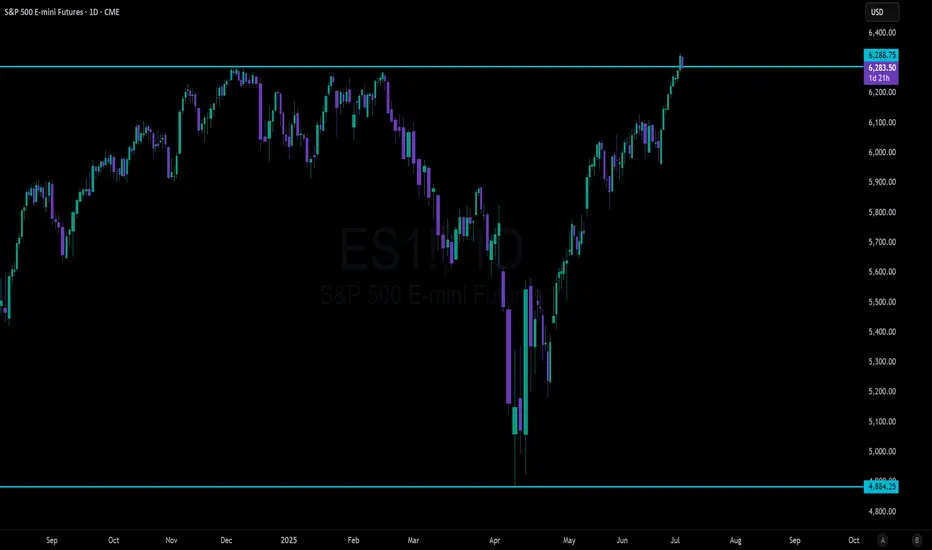
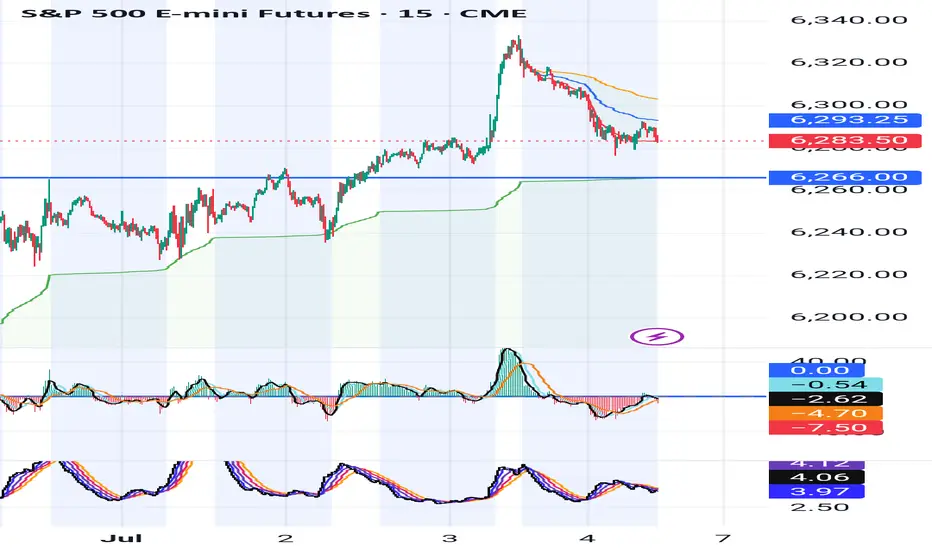
ES, SPY, SPX will be testing key support on Sunday After a welcome rally into new highs for the s&p, there appears to be a critical crossroad forming. Using the ES continuous contract I have placed 2 anchored VWAP's. The first being anchored to the last higher low on Thursday, June 19. And the the second, being anchored to this last Thursdays high on July 3rd.
For this post we will call the anchor from June 19 - VWAP1. And for the July 3rd anchor - VWAP2
VWAP1 r1 has acted as a key support line since the higher low was set. Successfully bouncing and holding support several times.
As we headed lower on this Thursdays July 3rd session, we remained between the center and r1 of VWAP2 indicating strong selling pressure for the day. With it being a shortened trading day with less liquidity however, I have less concern over the days price action. The forming crossroads and the upcoming Sundays open will be more telling for where we likely head this week.
The blue Horizontal Line at 6266 is placed directly on VWAP1s r1 (green line) which has acted as support. If we trade into this level on the Sunday open, it's a clear signal the sellers are still in control. If however, price can consolidate at that level (6266) and form structure, a breakout of the structure would be evidence of sellers backing off and buyers stepping in creating a good buying opportunity for the week.
Another possible scenario, if we first manage to trade up into s1 of VWAP2 (orange line) around the 6300 level, I will be looking for a short scalp down to the r1 of VWAP1 at 6266. From here it would be prudent to sit and wait for more confirmation on if this is a reversal, or just another pullback in the uptrend.
These are my two trade setups and ideas for Sunday's open. Hope this analysis helps. Happy trading 🤙💰📈
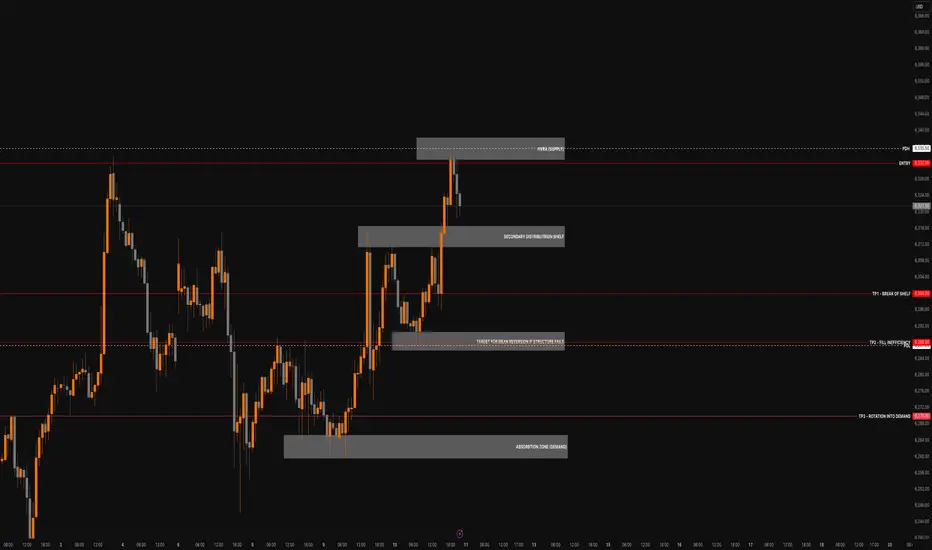
MES1! Stacked Rejection & Distribution into NY ClosePrice is stalling above PDH after tapping a clear HVRA (Supply) zone. We’re seeing layered rejection with a Secondary Distribution Shelf forming beneath it a classic signature of trapped longs and passive seller absorption.
If structure fails to hold above the rejection zone, we expect a reversion through the inefficiency and potential rotation into the demand base.
Key Zones & Structure
HVRA (Supply): 6345–6355 – Liquidity exhaustion, failed breakout
Secondary Distribution Shelf: 6315–6325 – Trap zone, weak re-test
Mean Reversion Target: 6285–6295 – Execution gap, inefficient rotation
Absorption Zone (Demand): 6260–6275 – Institutional long buildup
Bearish Trade Idea
Entry: 6332 (within HVRA)
Stop: 6342 (above HVRA high)
TP1: 6300 – Break of shelf
TP2: 6288 – Fill inefficiency
TP3: 6270 – Rotation into demand
R:R: Approx. 1:2.8 / 1:4.2 depending on target
Staakd Outlook
Stacked rejection with no volume follow-through above PDH. Unless NY reclaims 6330+ with force, structure favoUrs reversion to inefficiency and absorption zone below.
Follow for post-session confirmation and Friday morning bias update.
Staakd Bias: Bearish Lean ★★★★☆
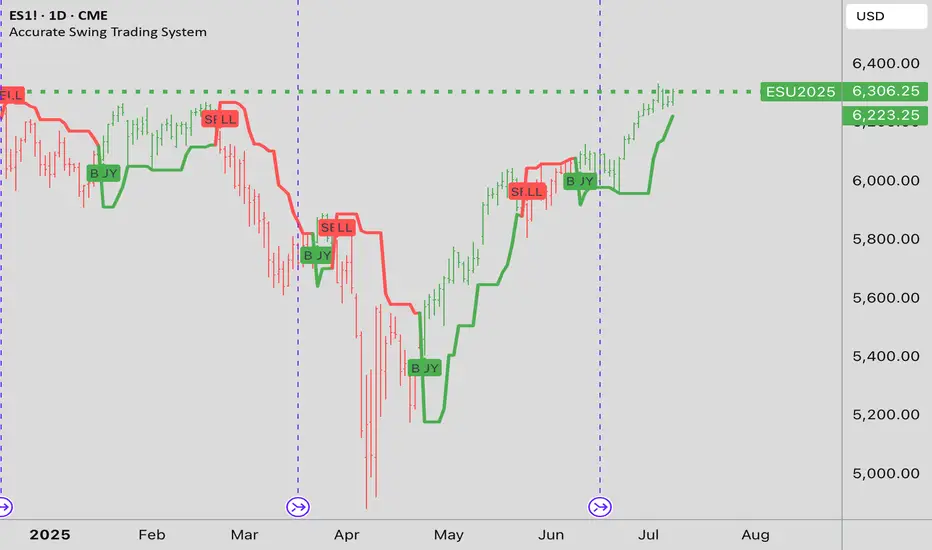
In forty years of trading, I have tried a lot of methods....In forty years of trading, I have tried a lot of methods. Over the years, things have changed. Right now, I swing trade S & P 500 Index ETFs through a commission free broker off this chart
GLOBEX FUTURES and this one single indicator. I always enter after the daily close, in the aftermarket. Trade at a price, a limit order "all or none". NOTE: You must chart FUTURES to get the signal at 6:00 PM NYC time in order to have it to position in the aftermarket. if you, chart SPX cash market, the TradingView "runtime" won't show the signal until the RTH opening "tomorrow". NO GOOD ...because overnight trading can gap the cash market. Try 5 minute chart for DAY trading Futures: use only RTH ! try configuring 3, 7, and 13, "swing" values. Happy trades! P.S. I am long right now SPX ETF.
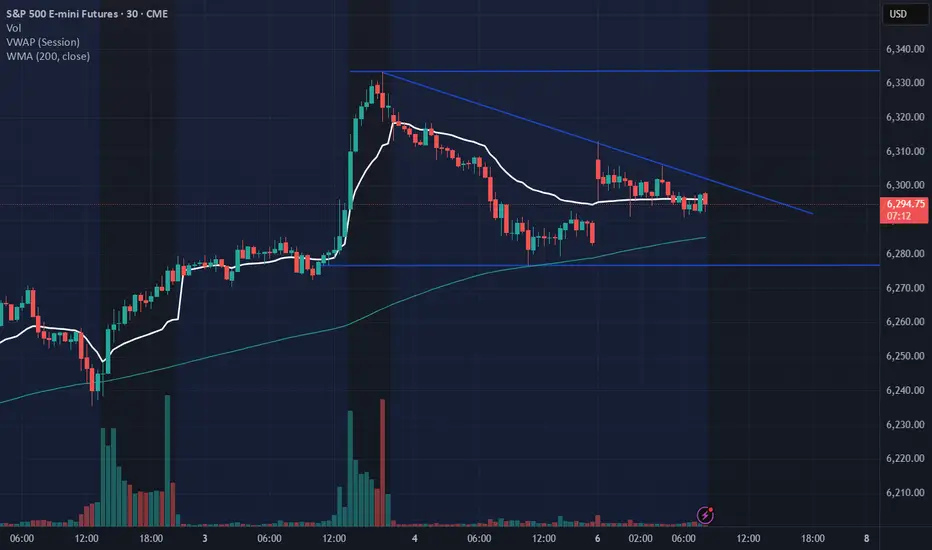
Inside to higher Although the S&P 500 daily chart broke to the downside the Asia session is indicating buyers are supporting this market. It implies an inside day within Thursday’s range to a higher close going into the weekend.

ES1! S&P500 Might Lose Momentum As Tariffs Deal Not Set...price could probably be testing all time highs. Before plunging....
if the volumes comes with it and reaches the all times high levels, that could be a nice short entry point for potential profits.
Otherwise, it could probably just fill the gap on week open and keep going down in a regular pattern until August as Trumps Tariffs Deals deadline is around that time possiblily...
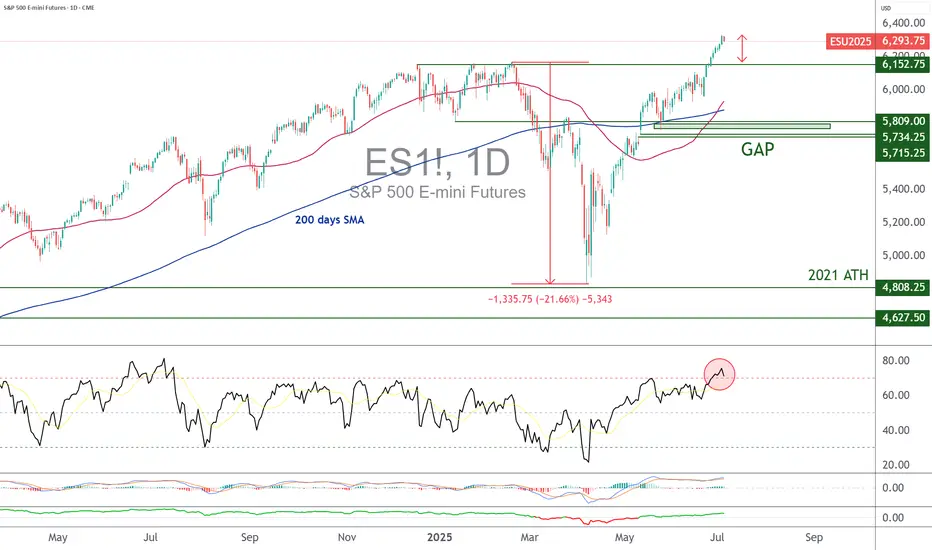
July 9, the next key date for the S&P 5001) Caution: the S&P 500 is now in short-term technical overbought territory and may enter a retracement (without jeopardizing the underlying uptrend)
Over the past two weeks, the S&P 500 future contract has technically broken above its all-time high of 6,150 points, thereby validating a signal that the underlying uptrend is continuing. The market has risen for several consecutive sessions without pausing, and is now overbought in the short term. From a purely technical point of view, the market is therefore exposed to a reversal, and a test of its former all-time high is a possible scenario for deflating short-term overboughtness and waiting for dynamic support.
The chart below shows the monthly, weekly and daily Japanese candlesticks for the S&P 500 future contract. You can see that there is still potential on the long-term timeframes, but the short-term framework (daily timeframe) is overbought in terms of momentum (momentum being represented here by the RSI technical indicator). The market will need to be able to hold the 6000/6150 technical support in order to preserve the uptrend in place since the beginning of April.
2) The US labor market remains resilient according to the latest NFP report, which is good news for the macro-economic situation, but postpones the FED rate cut
The US job market has just delivered an unexpected signal: the unemployment rate has fallen to 4.1% of the working population, after several months of stability around 4.2%. Although this drop may seem modest, it comes at a time when the Federal Reserve (Fed) is closely monitoring the labor market for signs of a more pronounced slowdown in economic activity. This drop in unemployment suggests that, despite the monetary tightening of the past two years, the US economy remains resilient. It is now unlikely that the FED will resume cutting the federal funds rate on Wednesday July 30.
3) BEWARE of the Wednesday July 9 deadline for trade agreements between the USA and its trading partners
US President Donald Trump has confirmed that the USA plans to send a series of official notifications to several trading partners from this Friday July 4, setting unilateral tariffs that will take effect from August 1. A dozen letters will be sent initially, followed by further mailings over the next few days. This marks a new stage in his strategy of pressuring foreign countries to conclude agreements before the deadline he had announced for Wednesday July 9.
At this stage, it seems unlikely that the Wednesday July 9 deadline will be extended. So it's important to bear in mind that the trend at the very beginning of next week will be directly influenced by the news coming in on the trade war/diplomacy. The S&P 500 index will react very directly to this information. We need trade agreements with China, India, the European Union and Japan if we are not to jeopardize the S&P 500's fundamental uptrend.
DISCLAIMER:
This content is intended for individuals who are familiar with financial markets and instruments and is for information purposes only. The presented idea (including market commentary, market data and observations) is not a work product of any research department of Swissquote or its affiliates. This material is intended to highlight market action and does not constitute investment, legal or tax advice. If you are a retail investor or lack experience in trading complex financial products, it is advisable to seek professional advice from licensed advisor before making any financial decisions.
This content is not intended to manipulate the market or encourage any specific financial behavior.
Swissquote makes no representation or warranty as to the quality, completeness, accuracy, comprehensiveness or non-infringement of such content. The views expressed are those of the consultant and are provided for educational purposes only. Any information provided relating to a product or market should not be construed as recommending an investment strategy or transaction. Past performance is not a guarantee of future results.
Swissquote and its employees and representatives shall in no event be held liable for any damages or losses arising directly or indirectly from decisions made on the basis of this content.
The use of any third-party brands or trademarks is for information only and does not imply endorsement by Swissquote, or that the trademark owner has authorised Swissquote to promote its products or services.
Swissquote is the marketing brand for the activities of Swissquote Bank Ltd (Switzerland) regulated by FINMA, Swissquote Capital Markets Limited regulated by CySEC (Cyprus), Swissquote Bank Europe SA (Luxembourg) regulated by the CSSF, Swissquote Ltd (UK) regulated by the FCA, Swissquote Financial Services (Malta) Ltd regulated by the Malta Financial Services Authority, Swissquote MEA Ltd. (UAE) regulated by the Dubai Financial Services Authority, Swissquote Pte Ltd (Singapore) regulated by the Monetary Authority of Singapore, Swissquote Asia Limited (Hong Kong) licensed by the Hong Kong Securities and Futures Commission (SFC) and Swissquote South Africa (Pty) Ltd supervised by the FSCA.
Products and services of Swissquote are only intended for those permitted to receive them under local law.
All investments carry a degree of risk. The risk of loss in trading or holding financial instruments can be substantial. The value of financial instruments, including but not limited to stocks, bonds, cryptocurrencies, and other assets, can fluctuate both upwards and downwards. There is a significant risk of financial loss when buying, selling, holding, staking, or investing in these instruments. SQBE makes no recommendations regarding any specific investment, transaction, or the use of any particular investment strategy.
CFDs are complex instruments and come with a high risk of losing money rapidly due to leverage. The vast majority of retail client accounts suffer capital losses when trading in CFDs. You should consider whether you understand how CFDs work and whether you can afford to take the high risk of losing your money.
Digital Assets are unregulated in most countries and consumer protection rules may not apply. As highly volatile speculative investments, Digital Assets are not suitable for investors without a high-risk tolerance. Make sure you understand each Digital Asset before you trade.
Cryptocurrencies are not considered legal tender in some jurisdictions and are subject to regulatory uncertainties.
The use of Internet-based systems can involve high risks, including, but not limited to, fraud, cyber-attacks, network and communication failures, as well as identity theft and phishing attacks related to crypto-assets.
End of Month and QuarterAs we wrapped up the end of the month and the end of the quarter, it can be helpful for traders to take time and look back on how markets have performed. The second quarter of 2025 showed extreme volatility in many markets, starting off with the strong broad selloff with the tariff announcement in early April, and as that was walked back the markets have rallied and equity markets are trading near all time high prices, specifically the S&P and Nasdaq. Traders also saw the Fed keep rates unchanged at the June meeting, stating that rate cuts are available if needed depending on the data.
As of now, the CME Fed Watch Tool is pricing in another pause for rates at the July meeting in a few weeks, and the first cut coming at the September meeting at a near 75% probability by 25 basis points. Powell has mentioned that the Fed does not want to be early with rate cuts, and wants to only use the cuts if necessary and as a tool. There will be imperative data looking at GDP, inflation, and jobs that may give traders an idea of the direction the Fed will go on rates for the second half of the year.
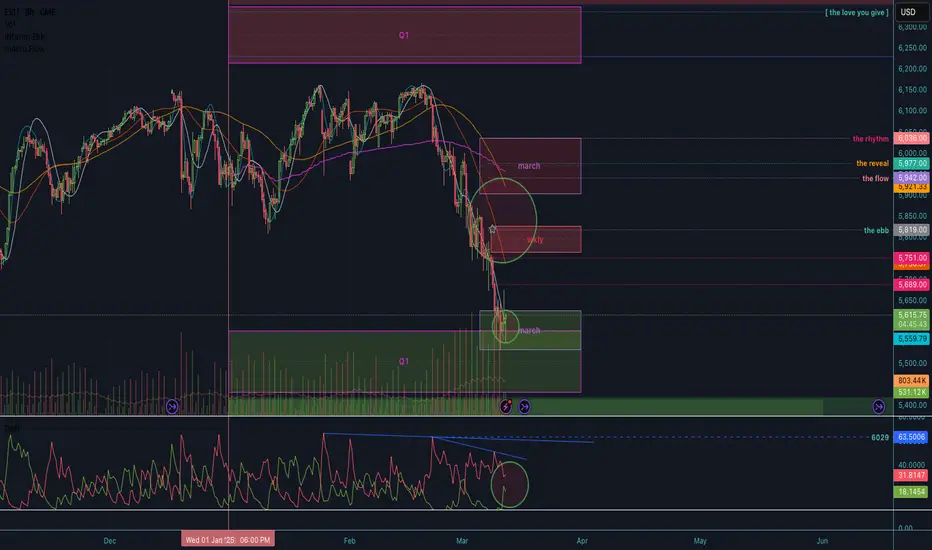
2025 Q1 + 6M/12M ranges 8h interim cycling bullish.
s1 @ 5554
r1 @ 5592
macro r1 @ 5738
sustain above and macro rotation pushes higher, r2 @ 5921.
its 8 days into the trading month and we've spent the entire 1M atr with extension to the downside.
8H / 1D interim rotation is bullish and no hh on di- since feb 27, despite almost a 500pt drop.
Extended boxes for 6M / 12M, and major levels noted for annual sup/res also marked.
In the last 20+ years, 12M candles closing red still printed an avg 4.74% H above the open; and after hitting lows, closed the year with an 9.97% rebound.
The rotation is a feature not a flaw.
Accept that it's fixed, and you'll see that nothing is broken.
You'll know the signal when you see it.
Appreciate the risk.
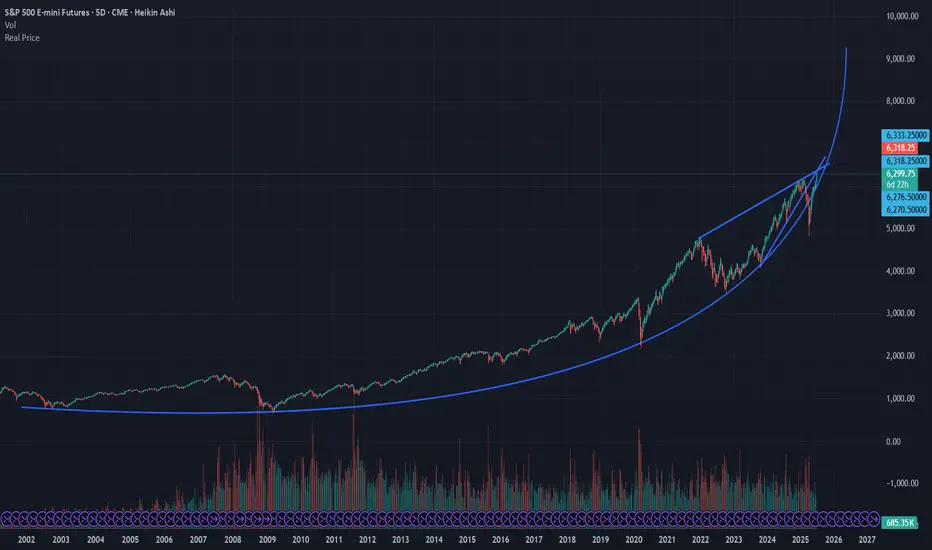
SPX inflection point: Parabolic Up or Breakdown? See here the entire futures contract (ES front contract) history for the S and P. What becomes very clear from connecting the lows is that the S and P has been growing parabolic over its futures chart *entire* history.
So we are now at an inflection point in the stock market history. For the first time this year, we below the parabolic arc. It reclaimed it in May to only right now be bumping up against two major intersecting resistance lines.
If we break through, hold on to your hats because we are going wayyyyy higher. Just to keep the parabolic growth curve would put us 50% higher by next year. If we breakdown, look out below. There is no support below this parabolic arc and the implosion could be catastrophic.
Either way good luck and happy trading!
Risk On! Buy Stock Indices, Sell Gold, Silver.In this Weekly Market Forecast, we will analyze the S&P 500, NASDAQ, DOW JONES, Gold and Silver futures, for the week of June 29 - July 4th..
Stock Indices are pointed to the all time highs. Take advantage of the "risk on" environment while it lasts!
Gold and Silver have seen the outflows and profit taking... so look for lower prices this week.
Oil ... be patient. After a huge dump in prices when the tensions eased up between Israel/US and Iran, price is moving sideways in consolidation. I suspect lower prices to come, but I urge patience! Wait for the signature of price to show it intends to move lower. A sweep of the range highs and a run of the range lows right after... is the signal to sell.
Enjoy!
May profits be upon you.
Leave any questions or comments in the comment section.
I appreciate any feedback from my viewers!
Like and/or subscribe if you want more accurate analysis.
Thank you so much!
Disclaimer:
I do not provide personal investment advice and I am not a qualified licensed investment advisor.
All information found here, including any ideas, opinions, views, predictions, forecasts, commentaries, suggestions, expressed or implied herein, are for informational, entertainment or educational purposes only and should not be construed as personal investment advice. While the information provided is believed to be accurate, it may include errors or inaccuracies.
I will not and cannot be held liable for any actions you take as a result of anything you read here.
Conduct your own due diligence, or consult a licensed financial advisor or broker before making any and all investment decisions. Any investments, trades, speculations, or decisions made on the basis of any information found on this channel, expressed or implied herein, are committed at your own risk, financial or otherwise.
