AMP Futures | OCO Bracket orders with Chart Trading.In this idea we will demonstrate how to apply an OCO bracket order on the Chart trader using TradingView.
Related futures

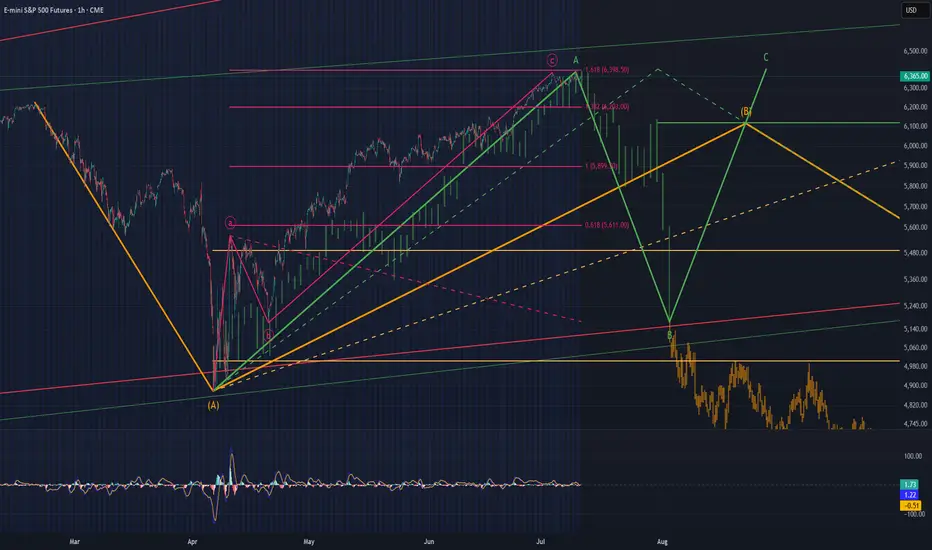
Are We Completing the Larger Ending Diagonal Now?The last time I updated followers of my work; I stated that the pattern was advancing, but NOT with confidence, and that it is marked with choppy, overlapping price action that appears to be an ending diagonal. Those sentiments have not changed.
However, what has changed is I was forecasting a mo
How to Spot Flag Patterns on TradingViewLearn to identify and trade flag patterns in TradingView with this step-by-step tutorial from Optimus Futures. Flag patterns are continuation formations that help traders join existing trends by buying high and selling higher, or selling low and buying back lower.
What You'll Learn:
• How to identi

AMP Futures - How to export data from your Trading PanelIn this idea, we will demonstrate how to export data from your Trading Panel using the TradingView platform.
Unfortunately, the recording did not show the demonstration of the exported CSV files; however, as long as you follow the steps provided, you will be able to export the proper data.

14 day look ahead at ES spy futures
CME_MINI:ES1! I am watching fundamentals and any incoming tariff news this week (mostly for scalps on small timeframes). This is because of the Japan news reaction we saw last week which presented good opportunity.
Bear: I am watching price seek possible consolidation up here after being bulli
DIYWallSt Trade Journal: Missed Entry & Climbing Back From Loss **07/11/25 Trade Journal, and ES_F Stock Market analysis **
EOD accountability report: -46.25
Sleep: 5 hours
Overall health: Good
** VX Algo System Signals from (9:30am to 2pm) 3/3 success**
— 9:41 AM Market Structure flipped bearish on VX Algo X3!
— 10:15 AM VXAlgo ES X7 Buy signal,
— 1


TACO about to become TUFTThe acronym "TACO" has been adopted as a market slogan to explain the shocking volatility brought on by Trump's follow through with his campaign promises to enact and/or adjust tariff's in the USA on its trading partners around the world. The mere mention resulted in a 1,334 point sell-of culminati
DXY, EURUSD, ES1! Daily Trade SetupsIn this update we review the recent price action in the Dollar Index, EURUSD & E-mini SP500 and identify the next high-probability trading opportunities and price objectives to target. To review today's video analysis, click here!

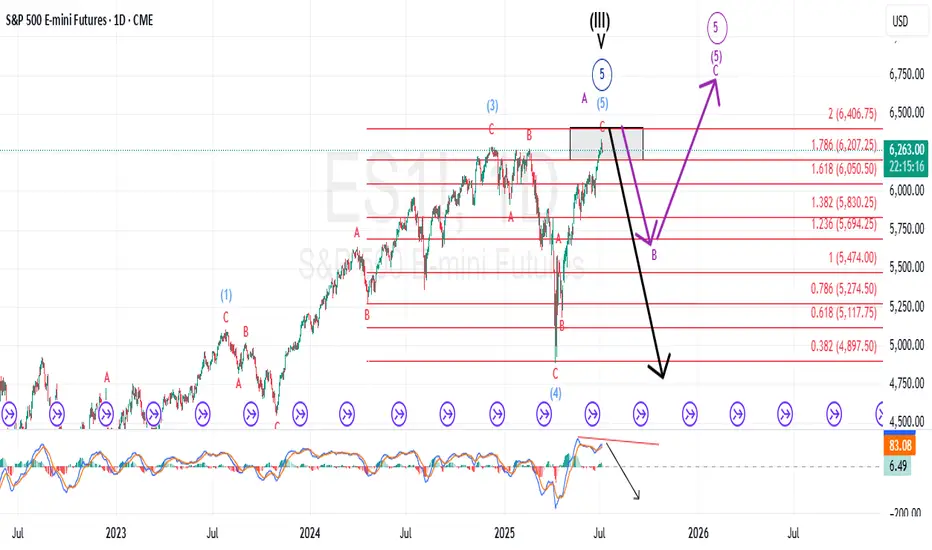
Accumulation to Acceleration ESThis chart shows a long-term market analysis using Elliott Wave Theory, suggesting the market is currently in Wave 4 and preparing for a big Wave 5 rally.
📈 Past yearly moves averaged 15–21%, with 30%+ currently and up to 66% historically.
🟩 A "rebalance" zone (accumulation phase) is formi

See all ideas
Summarizing what the indicators are suggesting.
Neutral
SellBuy
Strong sellStrong buy
Strong sellSellNeutralBuyStrong buy
Neutral
SellBuy
Strong sellStrong buy
Strong sellSellNeutralBuyStrong buy
Neutral
SellBuy
Strong sellStrong buy
Strong sellSellNeutralBuyStrong buy
A representation of what an asset is worth today and what the market thinks it will be worth in the future.
Displays a symbol's price movements over previous years to identify recurring trends.
Frequently Asked Questions
The current price of Micro S&P 500 Futures is 6,410.50 USD — it has fallen −0.37% in the past 24 hours. Watch Micro S&P 500 Futures price in more detail on the chart.
Track more important stats on the Micro S&P 500 Futures chart.
The nearest expiration date for Micro S&P 500 Futures is Mar 20, 2026.
Traders prefer to sell futures contracts when they've already made money on the investment, but still have plenty of time left before the expiration date. Thus, many consider it a good option to sell Micro S&P 500 Futures before Mar 20, 2026.
Buying or selling futures contracts depends on many factors: season, underlying commodity, your own trading strategy. So mostly it's up to you, but if you look for some certain calculations to take into account, you can study technical analysis for Micro S&P 500 Futures. Today its technical rating is buy, but remember that market conditions change all the time, so it's always crucial to do your own research. See more of Micro S&P 500 Futures technicals for a more comprehensive analysis.