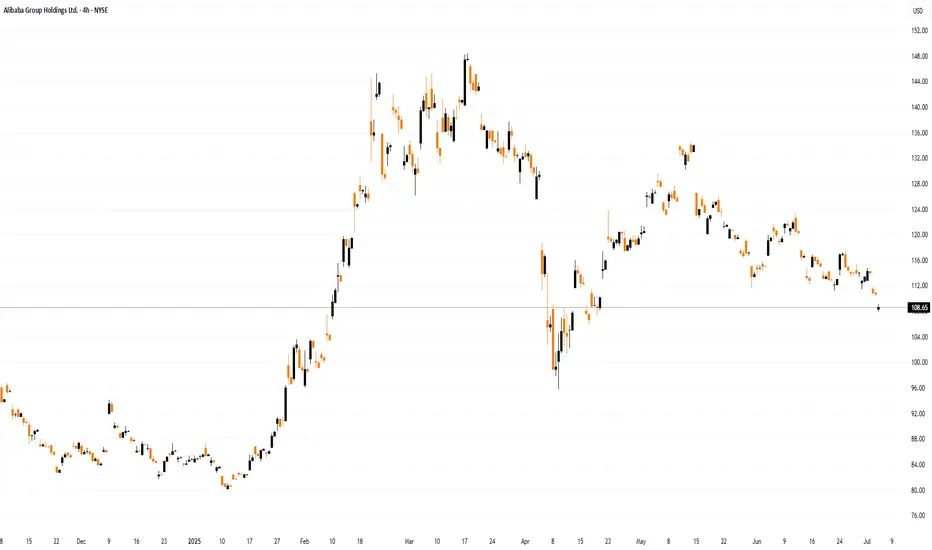
Alibaba (BABA) Shares Fall to Lowest Level in 2.5 MonthsAlibaba (BABA) Shares Fall to Lowest Level in 2.5 Months
Yesterday, Alibaba (BABA) shares dropped to their lowest level since late April. The decline followed the company’s announcement of a planned bond issuance totalling approximately $1.53 billion, with a maturity date set for 2032. The funds w
Next report date
—
Report period
—
EPS estimate
—
Revenue estimate
—
19.65 MXN
367.96 B MXN
2.83 T MXN
16.56 B
About Alibaba Group Holdings Ltd.
Sector
Industry
CEO
Yong Ming Eddie Wu
Website
Headquarters
Hangzhou
Founded
1999
FIGI
BBG012PPB6J5
Alibaba Group Holding Ltd. engages in providing technology infrastructure and marketing reach. It operates through the following business segments: China Commerce, International Commerce, Local Consumer Services, Cainiao, Cloud, Digital Media and Entertainment, and Innovation Initiatives and Others segments. The Core Commerce segment consists of platforms operating in retail and wholesale. The China Commerce segment includes China commerce retail and wholesale businesses. The International Commerce segment focuses on international commerce retail and wholesale businesses. The Local Consumer Services segment is involved in To-Home businesses, which include Ele.me, local services and delivery platform, and Taoxianda, and To-Destination segment businesses which include Amap, the provider of mobile digital map, navigation and real-time traffic information, and restaurant and local services guide platform. The Cainiao segment has Cainiao Network and offers domestic and international one-stop-shop logistics services and supply chain management solution. The Cloud segment includes Alibaba Cloud and DingTalk. The company was founded by Chung Tsai and Yun Ma on June 28, 1999 and is headquartered in Hangzhou, China.
Related stocks
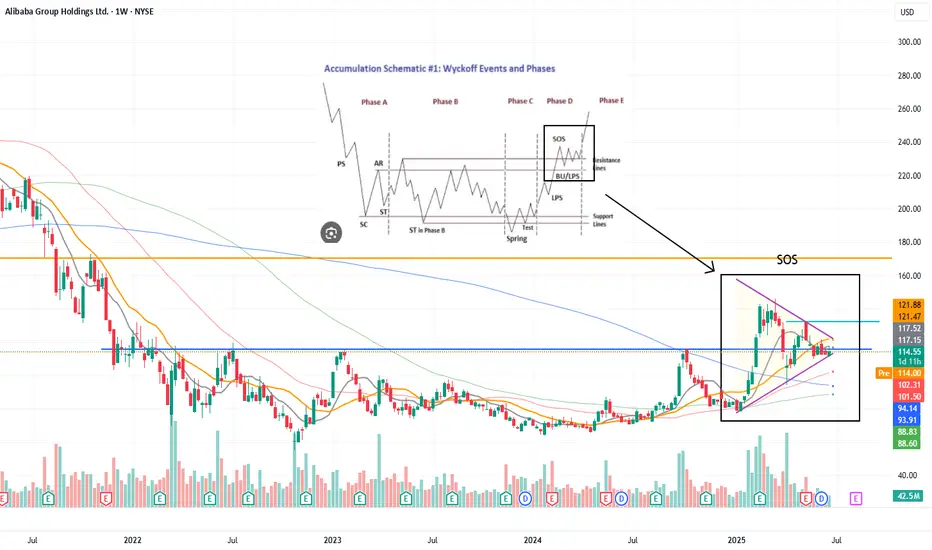
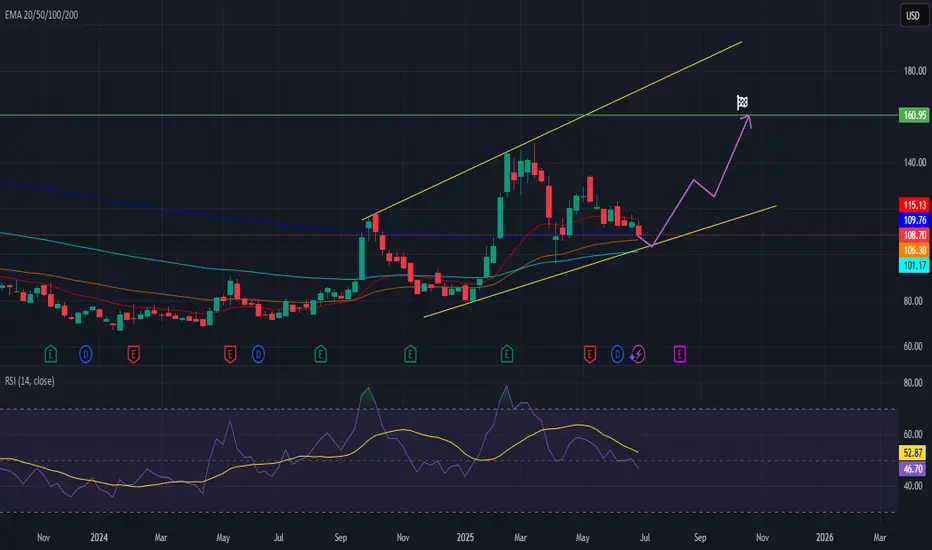
Alibaba on the lower upward trend lineAlibaba is on the upward trend line after years of a downward trend. The AI business is booming. The fundamentals speak for themselves. The price/earnings ratio for 2025 is around 12 and is on Value level. The conflict with the Chinese party seems to have improved. The company is buying back shares.
SOSPrice completing SOS phase of Wyckoff accumulation
Symmetrical triangle almost reached the break point and a strong move will soon happen
I expect an upward move but always set a stop loss to protect your money
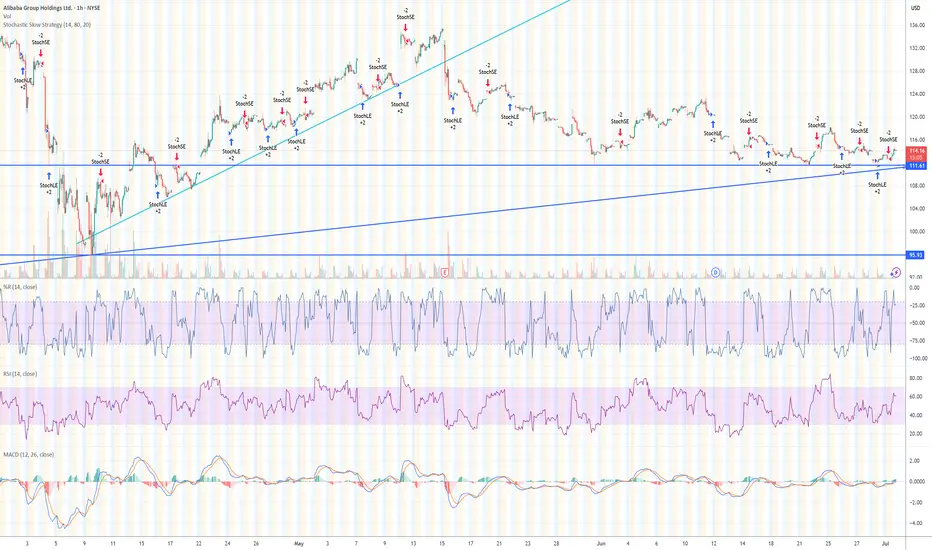
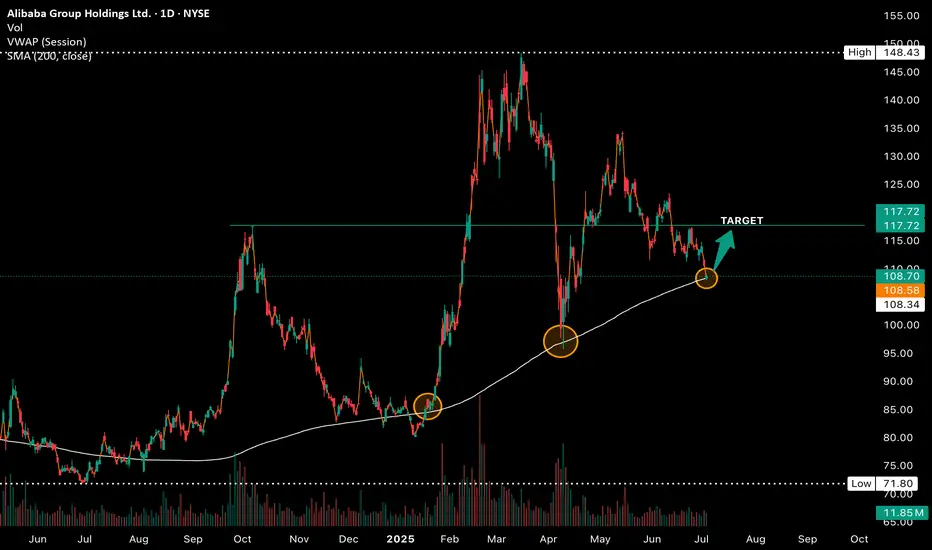
Long $BABA - NYSE:BABA is testing 200 SMA
- NYSE:BABA moves are explodes higher then cools then retest support then explodes higher than the last high. It's called trading with higher wavelength
-> Move 1: Started April 2024 when the trend reversal started. $68 -> $89 with around +30% then retraced $9
BABA – Dollar Cost Averaging Opportunityhi Traders,
Let's have a look at BABA.
Alibaba (BABA) appears to be approaching the end of its correction phase within a well-defined ascending channel. Based on the current price action and technical setup, we believe now is a good time to begin dollar cost averaging into this stock.
Our identif
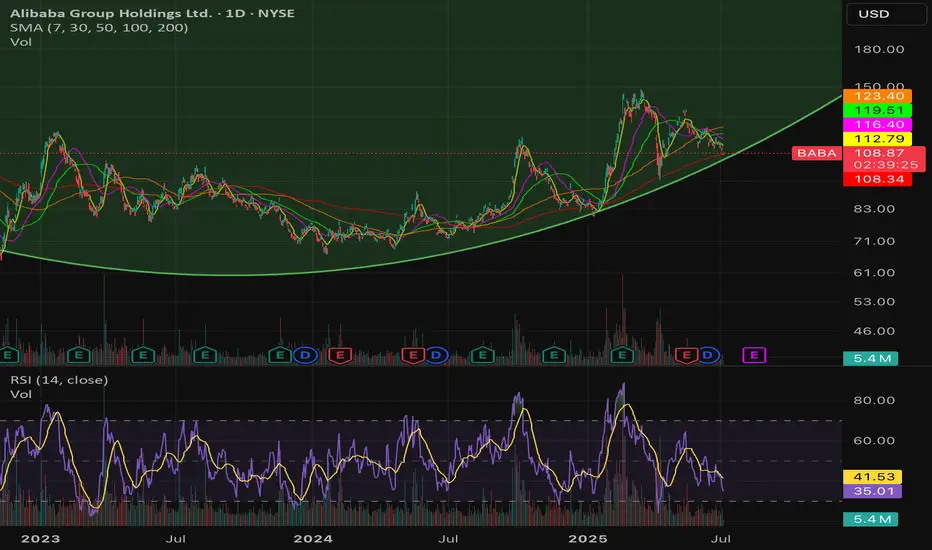
BABA: Testing Daily 200 SMA on Falling Wedge; Gimme Bounce Here!Baba is approaching the key level of the 200 SMA, a zone where price has respected and bounced sharply off in the past! What's crucial to note is this is occurring off of a falling wedge pattern, and RSI in the 30s showing oversold conditions.
- Calling 108 as an interim bottom here
- Looking for
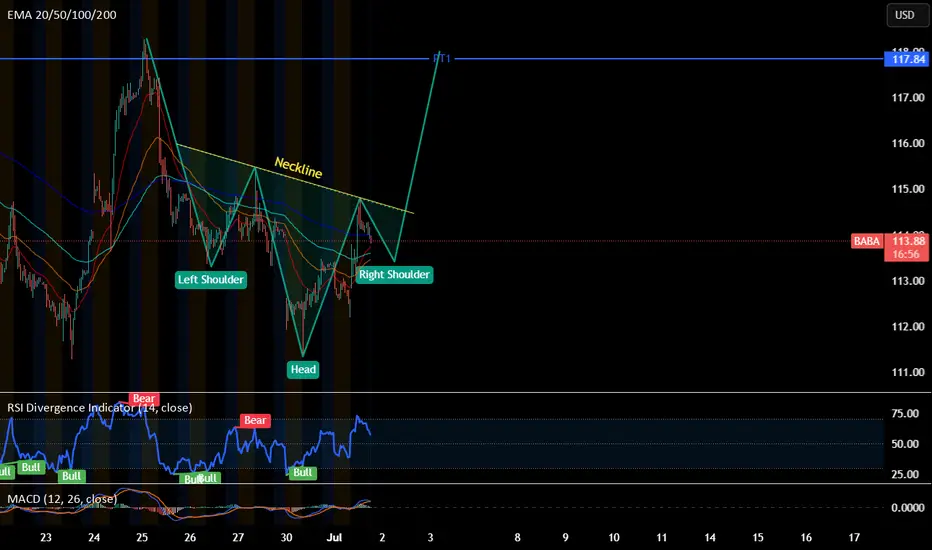
Call - BABADaily Chart Pattern : Falling Wedge
30 Min Chart Pattern : Head and shoulders. Forming right shoulder.
Enter call if it breaks neckline at $114.60 & monitor for a re-test
Stop loss if fails to re-test at ~$114
PT1: 117.84
Potential to retest ~$123.3. Will update after breaking PT1
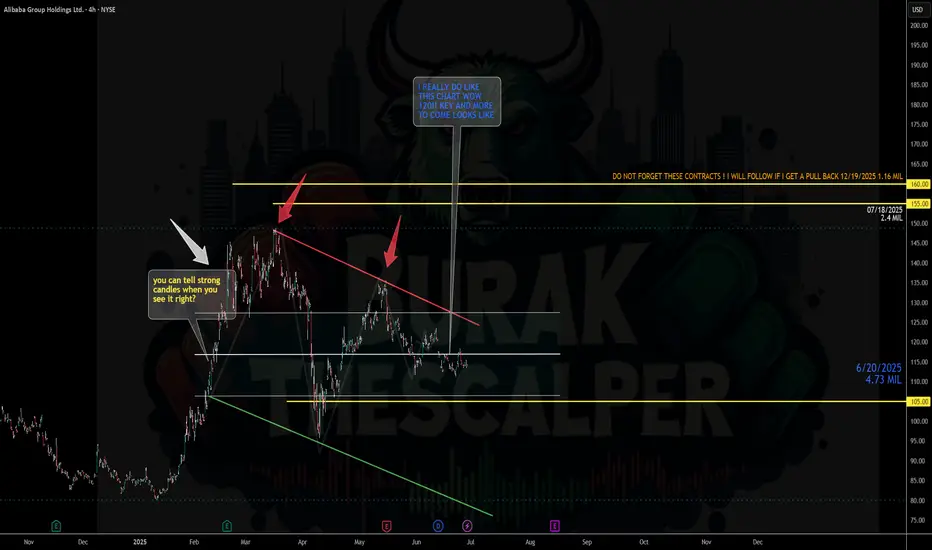
here is the #chart for $BABA Bullish with short-term caution. Alibaba ( NYSE:BABA ) is at $114.08, up 0.13% daily but down 2.92% monthly, as shown in the finance card above. X posts reflect bullish sentiment, citing a breakout above the 200-week moving average and a potential move toward $168-$183.13, driven by strong AI/cloud
How to use chart to determine your DCA strategyLooking at the monthly chart of Alibaba, it is unfortunately not out of the woods , yet ! Yes, there has been a slew of good news, government support, foreign investors pouring money into the big tech of China, etc. But, little does this move the bullish needle.
The yellow circle shows a bearish pi

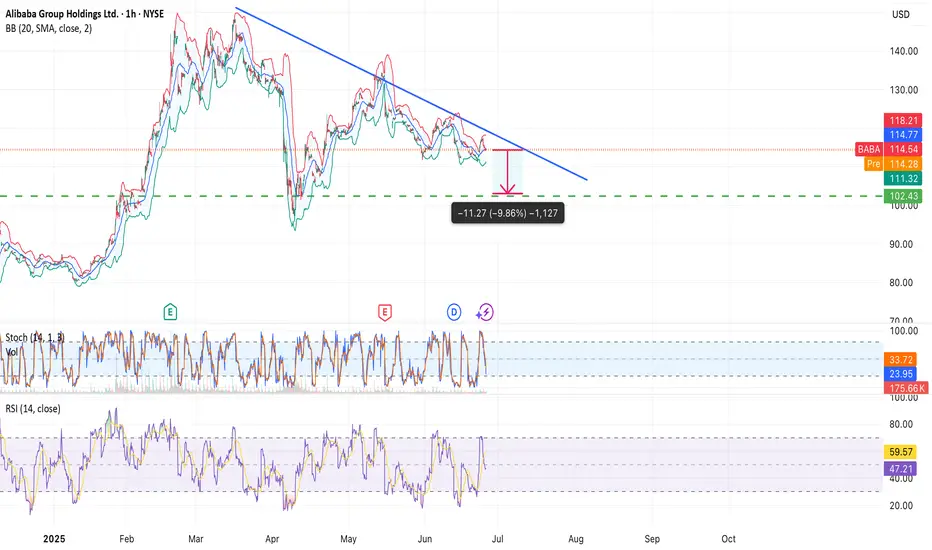
Alibaba (BABA) – Bearish Setup FormingNYSE:BABA
A descending triangle is forming on the chart, with strong resistance around $118 and horizontal support near $102. The structure suggests a potential breakdown, targeting a move of ~−9.8%.
Key observations:
• Price rejected from the descending trendline multiple times
• Stochastic tur
See all ideas
Summarizing what the indicators are suggesting.
Neutral
SellBuy
Strong sellStrong buy
Strong sellSellNeutralBuyStrong buy
Neutral
SellBuy
Strong sellStrong buy
Strong sellSellNeutralBuyStrong buy
Neutral
SellBuy
Strong sellStrong buy
Strong sellSellNeutralBuyStrong buy
An aggregate view of professional's ratings.
Neutral
SellBuy
Strong sellStrong buy
Strong sellSellNeutralBuyStrong buy
Neutral
SellBuy
Strong sellStrong buy
Strong sellSellNeutralBuyStrong buy
Neutral
SellBuy
Strong sellStrong buy
Strong sellSellNeutralBuyStrong buy
Displays a symbol's price movements over previous years to identify recurring trends.
Curated watchlists where 9988/N is featured.


Frequently Asked Questions
The current price of 9988/N is 290.56 MXN — it hasn't changed in the past 24 hours. Watch ALIBABA GROUP HOLDING LTD stock price performance more closely on the chart.
Depending on the exchange, the stock ticker may vary. For instance, on BMV exchange ALIBABA GROUP HOLDING LTD stocks are traded under the ticker 9988/N.
We've gathered analysts' opinions on ALIBABA GROUP HOLDING LTD future price: according to them, 9988/N price has a max estimate of 442.33 MXN and a min estimate of 249.64 MXN. Watch 9988/N chart and read a more detailed ALIBABA GROUP HOLDING LTD stock forecast: see what analysts think of ALIBABA GROUP HOLDING LTD and suggest that you do with its stocks.
9988/N reached its all-time high on Oct 27, 2021 with the price of 454.57 MXN, and its all-time low was 175.00 MXN and was reached on May 17, 2024. View more price dynamics on 9988/N chart.
See other stocks reaching their highest and lowest prices.
See other stocks reaching their highest and lowest prices.
9988/N stock is 0.00% volatile and has beta coefficient of 1.59. Track ALIBABA GROUP HOLDING LTD stock price on the chart and check out the list of the most volatile stocks — is ALIBABA GROUP HOLDING LTD there?
Today ALIBABA GROUP HOLDING LTD has the market capitalization of 4.47 T, it has decreased by −6.57% over the last week.
Yes, you can track ALIBABA GROUP HOLDING LTD financials in yearly and quarterly reports right on TradingView.
ALIBABA GROUP HOLDING LTD is going to release the next earnings report on Aug 14, 2025. Keep track of upcoming events with our Earnings Calendar.
9988/N earnings for the last quarter are 4.46 MXN per share, whereas the estimation was 4.38 MXN resulting in a 1.69% surprise. The estimated earnings for the next quarter are 5.47 MXN per share. See more details about ALIBABA GROUP HOLDING LTD earnings.
ALIBABA GROUP HOLDING LTD revenue for the last quarter amounts to 673.68 B MXN, despite the estimated figure of 674.24 B MXN. In the next quarter, revenue is expected to reach 665.87 B MXN.
9988/N net income for the last quarter is 34.85 B MXN, while the quarter before that showed 142.01 B MXN of net income which accounts for −75.46% change. Track more ALIBABA GROUP HOLDING LTD financial stats to get the full picture.
Yes, 9988/N dividends are paid annually. The last dividend per share was 4.73 MXN. As of today, Dividend Yield (TTM)% is 0.98%. Tracking ALIBABA GROUP HOLDING LTD dividends might help you take more informed decisions.
ALIBABA GROUP HOLDING LTD dividend yield was 0.80% in 2024, and payout ratio reached 13.85%. The year before the numbers were 1.39% and 22.64% correspondingly. See high-dividend stocks and find more opportunities for your portfolio.
As of Jul 5, 2025, the company has 124.32 K employees. See our rating of the largest employees — is ALIBABA GROUP HOLDING LTD on this list?
EBITDA measures a company's operating performance, its growth signifies an improvement in the efficiency of a company. ALIBABA GROUP HOLDING LTD EBITDA is 517.14 B MXN, and current EBITDA margin is 17.78%. See more stats in ALIBABA GROUP HOLDING LTD financial statements.
Like other stocks, 9988/N shares are traded on stock exchanges, e.g. Nasdaq, Nyse, Euronext, and the easiest way to buy them is through an online stock broker. To do this, you need to open an account and follow a broker's procedures, then start trading. You can trade ALIBABA GROUP HOLDING LTD stock right from TradingView charts — choose your broker and connect to your account.
Investing in stocks requires a comprehensive research: you should carefully study all the available data, e.g. company's financials, related news, and its technical analysis. So ALIBABA GROUP HOLDING LTD technincal analysis shows the buy rating today, and its 1 week rating is buy. Since market conditions are prone to changes, it's worth looking a bit further into the future — according to the 1 month rating ALIBABA GROUP HOLDING LTD stock shows the buy signal. See more of ALIBABA GROUP HOLDING LTD technicals for a more comprehensive analysis.
If you're still not sure, try looking for inspiration in our curated watchlists.
If you're still not sure, try looking for inspiration in our curated watchlists.